Generating a graph report
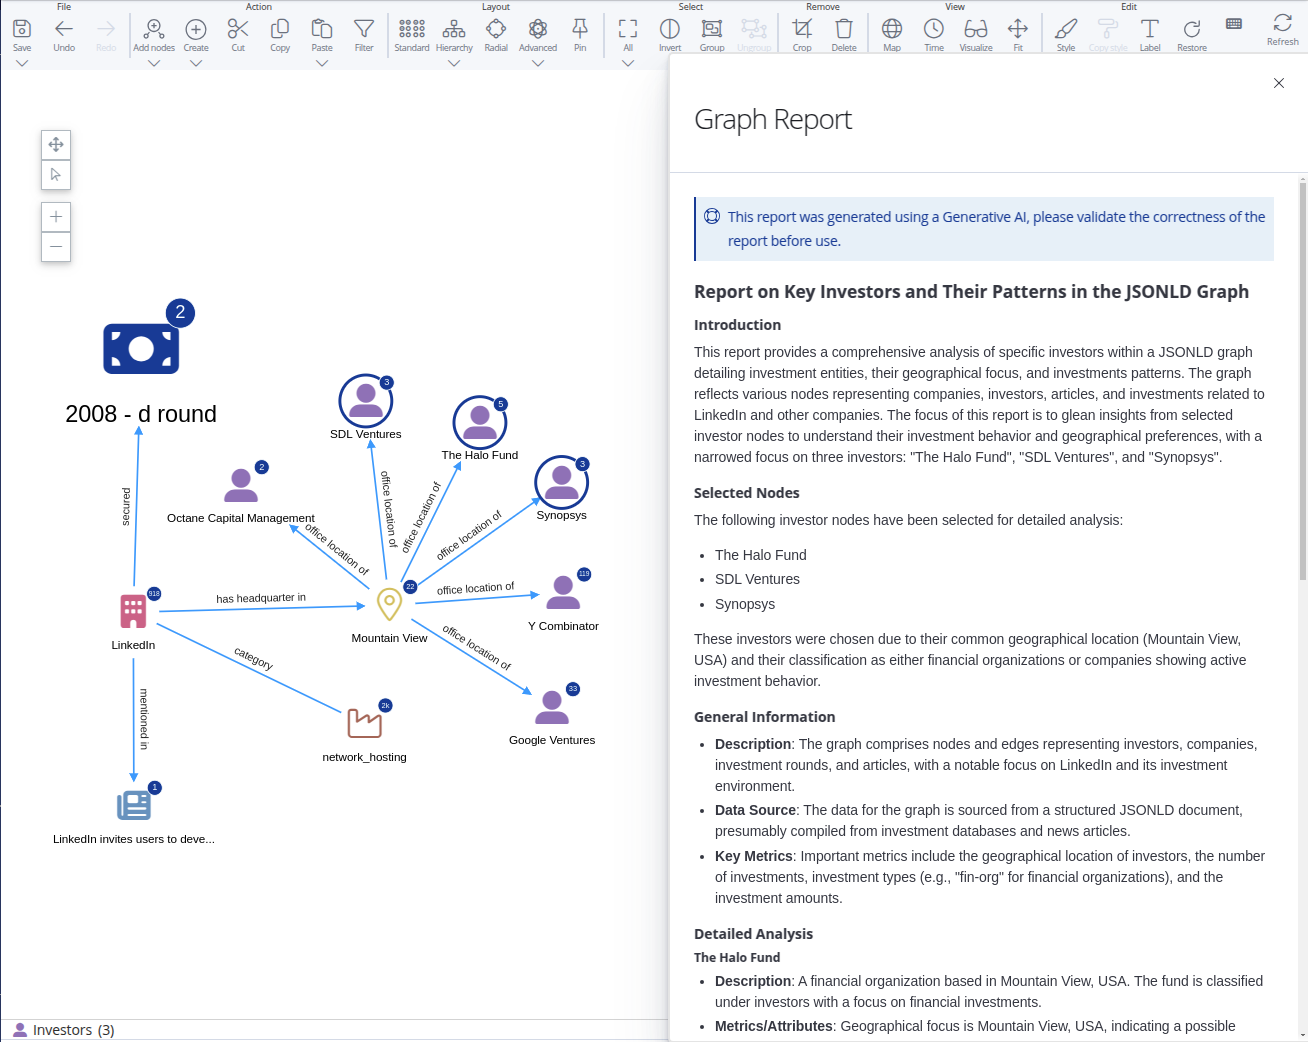
The Siren AI plugin provides a script that you can attach to a graph to generate a report. The script uses a large language model to analyze the graph and generate a report that describes the graph’s structure and content, focusing on any selected nodes. The generated report can also be downloaded as a .docx file.
Setup
On Investigate startup, a script is created for generating reports. To start generating graph reports, you only need to add it to a graph browser visualization as a context menu item:
-
Edit a graph browser visualization.
-
Go to the Scripts tab, and in the Contextual functions section, add the following item to the
sectionsarray:{ "id": "graph-reporting", "items": [ { "id": "generate-report", "label": "Create report", "icon": "far fa-file-export", "type": "action", "action": "sirenapiscript:e82cc510-d1a2-11ef-856c-f546f18e4d09", "disabled": "!areNodesPresent" } ] } -
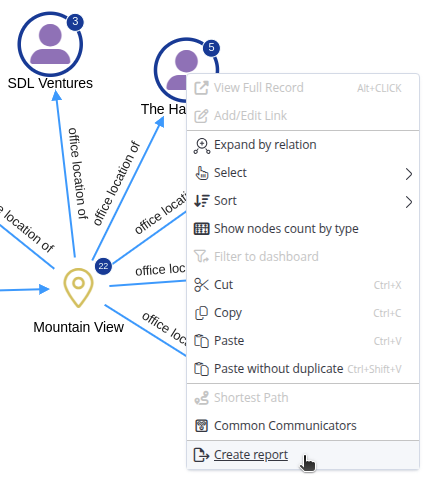
Save the visualization, and now when you right-click you should have the option for generating graph reports
Limitations
Depending on the LLM provider, model, or subscription tier, there may be restrictions on how much data can be sent (maximum tokens per request, max requests per period of time, etc.). If you encounter an error that references a rate limit, try generating a report with fewer nodes in the graph or waiting for the request quota to be refilled. Usage can typically be found on the LLM provider’s website.