Dashboards
Dashboards can be designed and created to display a set of visualizations that make investigating data easier and more streamlined.
When you want to present the results of an investigation, dashboards can be exported, shared with other users, or embedded in Web pages.
You can configure dashboards to represent data in the following ways:
-
Informational or summary dashboards. These dashboards do not represent any entity tables or searches.
-
Dashboards that derive data from a single entity table or search.
-
Dashboards that derive data from multiple entity tables; these are known as Dashboard 360.
For more information about entity tables, searches, and entity identifiers, see the Data model documentation.
Setting the dashboard data model
To configure a dashboard according to the above options, click Edit → Data Model in the Options menu.
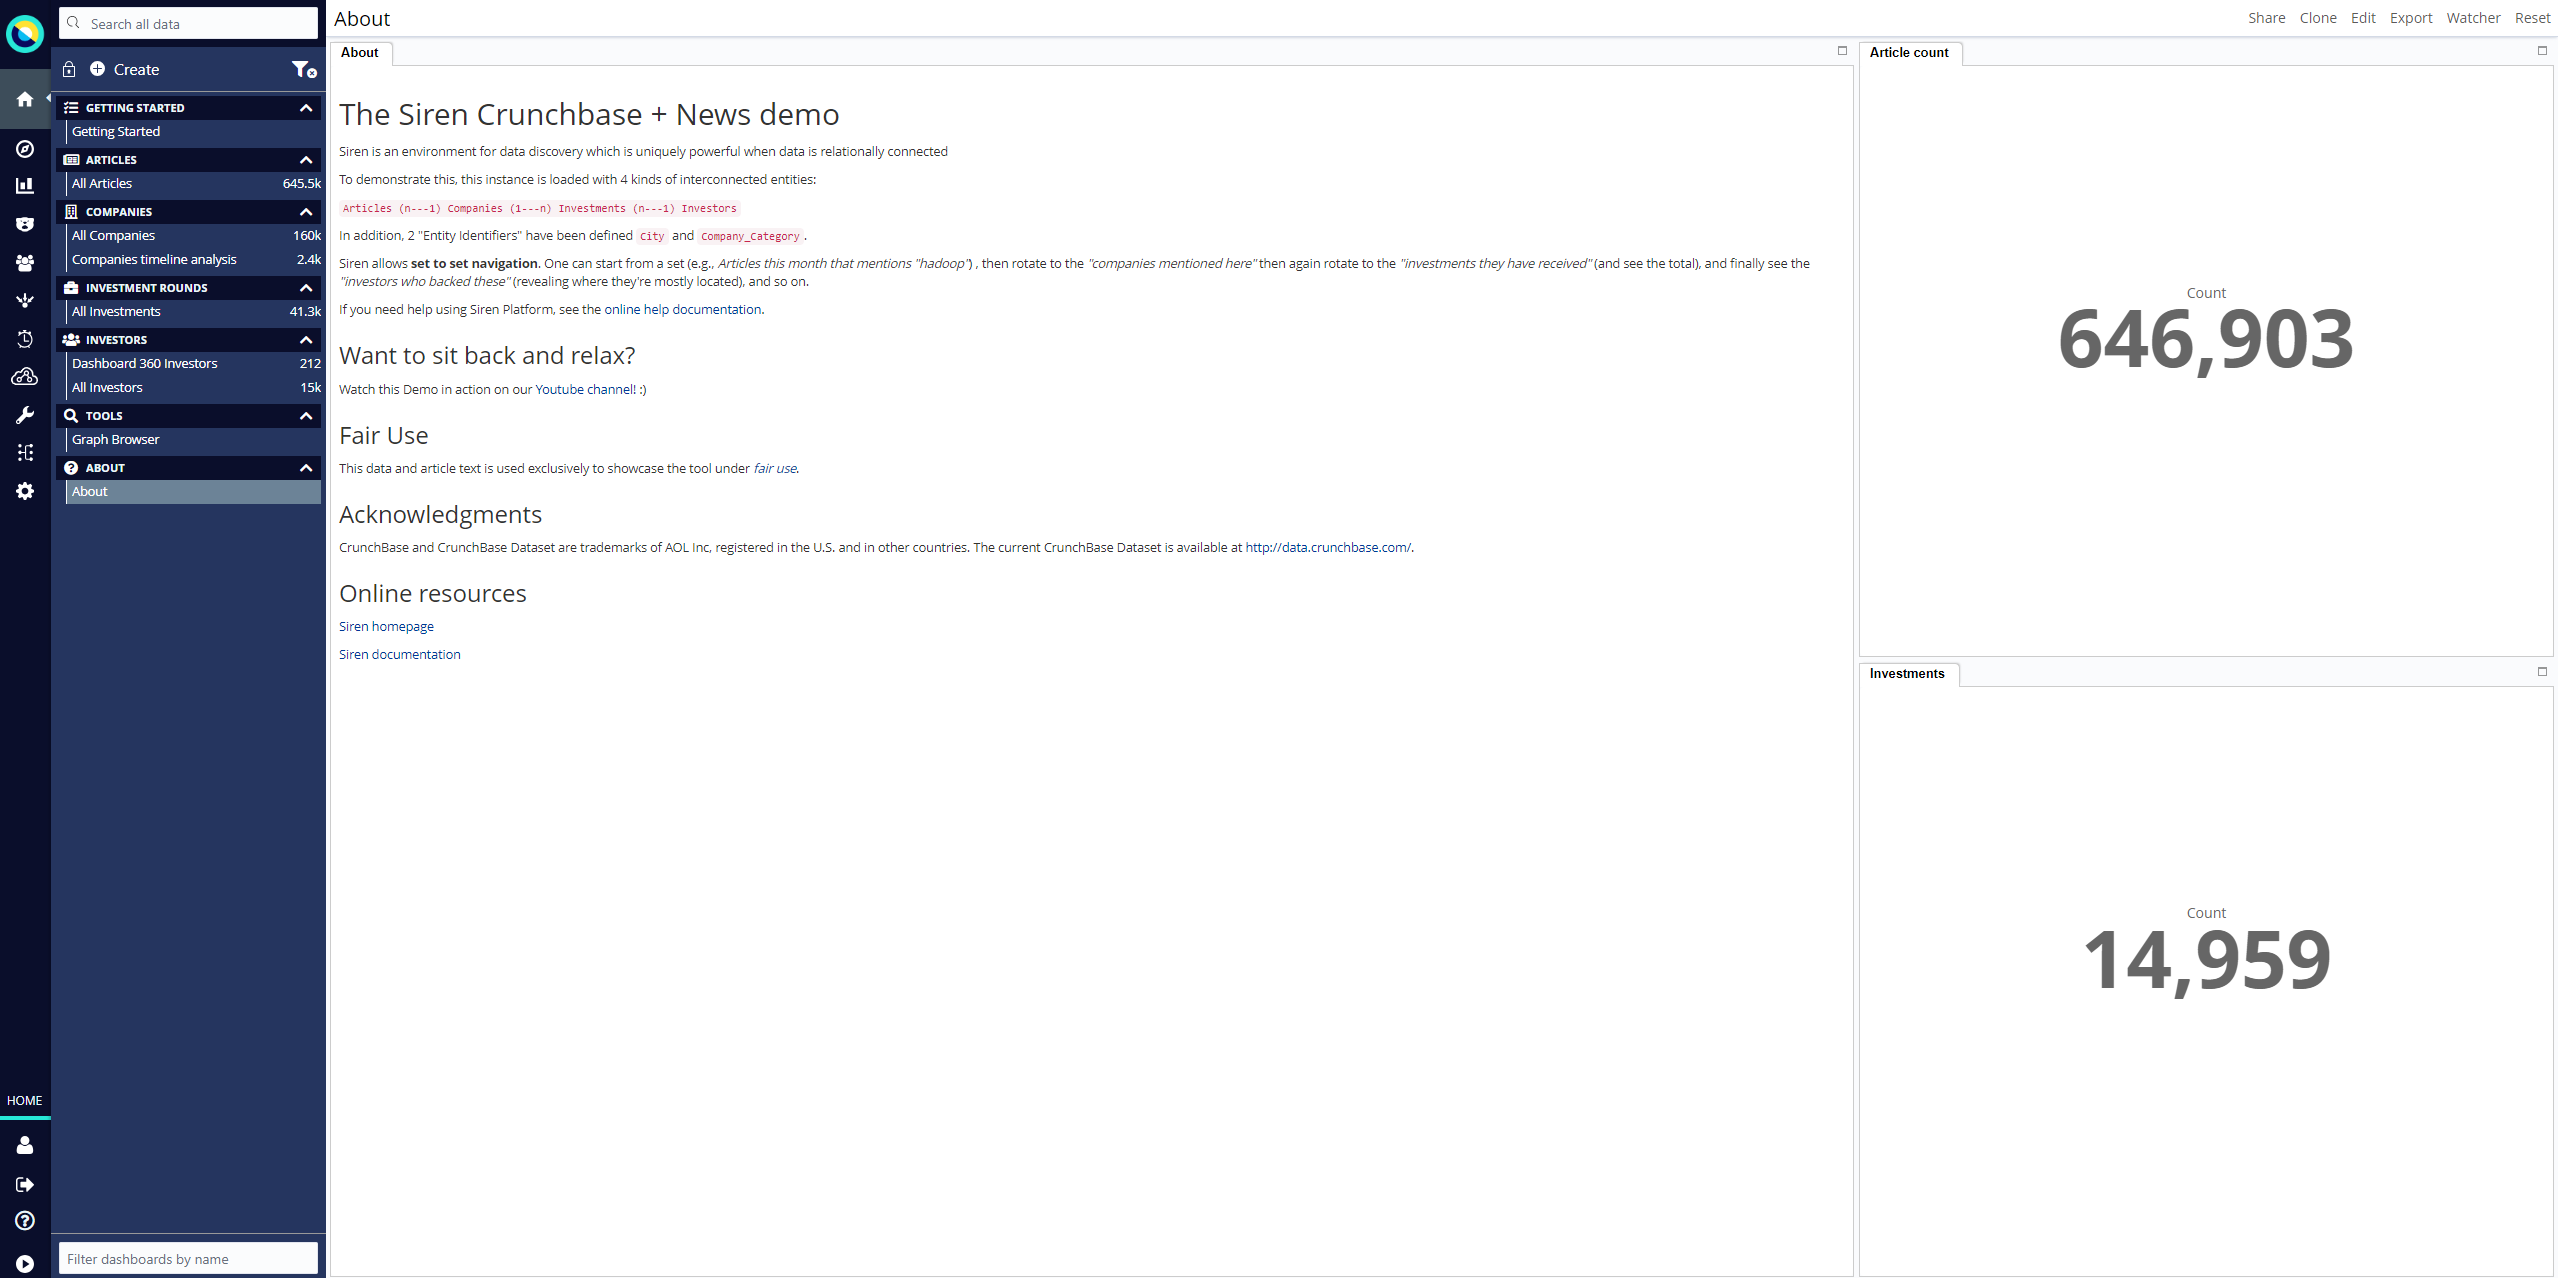
Dashboards that do not represent an entity table
Select this option when you are creating a dashboard that is not primarily about a set of entities.
For example, you can provide an introductory dashboard to give new analysts an overview of the data that is contained in the main dashboards.

|
For this type of dashboard, you can make the screen appear less cluttered by hiding the time filter and the search and filter bar. Click Edit → Options to update these settings. |
|
Dashboards that are not connected to an entity table or search do not display a record count and they cannot be used for relational navigation. |
Dashboards that represent an entity table
If a dashboard does need to display the data from a specific entity table or search, you configure it as follows:
-
In an open dashboard, click Edit → Data Model.
-
Select Dashboard represents an entity table.
-
Select the relevant entity table or search from the drop-down menu.
-
Click Save → Save dashboard.
This effectively binds the dashboard to the entity table, which results in the following:
-
The dashboard displays the record count and the icon that represents the entity table or search.
-
You can search for data in that entity table by entering a query in the Search bar.
-
You can add a Relational Navigator visualization.
-
You can drag and drop records from the dashboard into the Graph Browser.
Dashboard 360 with filter strategy
If a dashboard needs to display the data from multiple entity tables or searches, you configure it as a 360 dashboard.
For more information, see Creating 360 dashboards.
Visualizations and entity tables in a dashboard
A visualization is usually linked to an entity table or search. For example, a visualization that lists Article Authors is linked to the Articles entity table.
A dashboard can contain visualizations that are all linked to the same entity table (this provides a logical focus for the dashboard) or it can contain visualizations that are linked to multiple entity tables (Dashboard 360).
You can mix and match visualizations in dashboards, so that you present the types of data that are important for the investigation.
|
In the visualization configuration settings, you can specify that certain visualizations automatically link to the main search of a dashboard. For more information, see Linking visualizations to entity tables. |
For more information, see the Visualizations documentation.