Record Table visualization
The Record Table is a record-level visualization that shows a table of the best-scoring queried records. The table represents each record in a row and each column represents a different field.
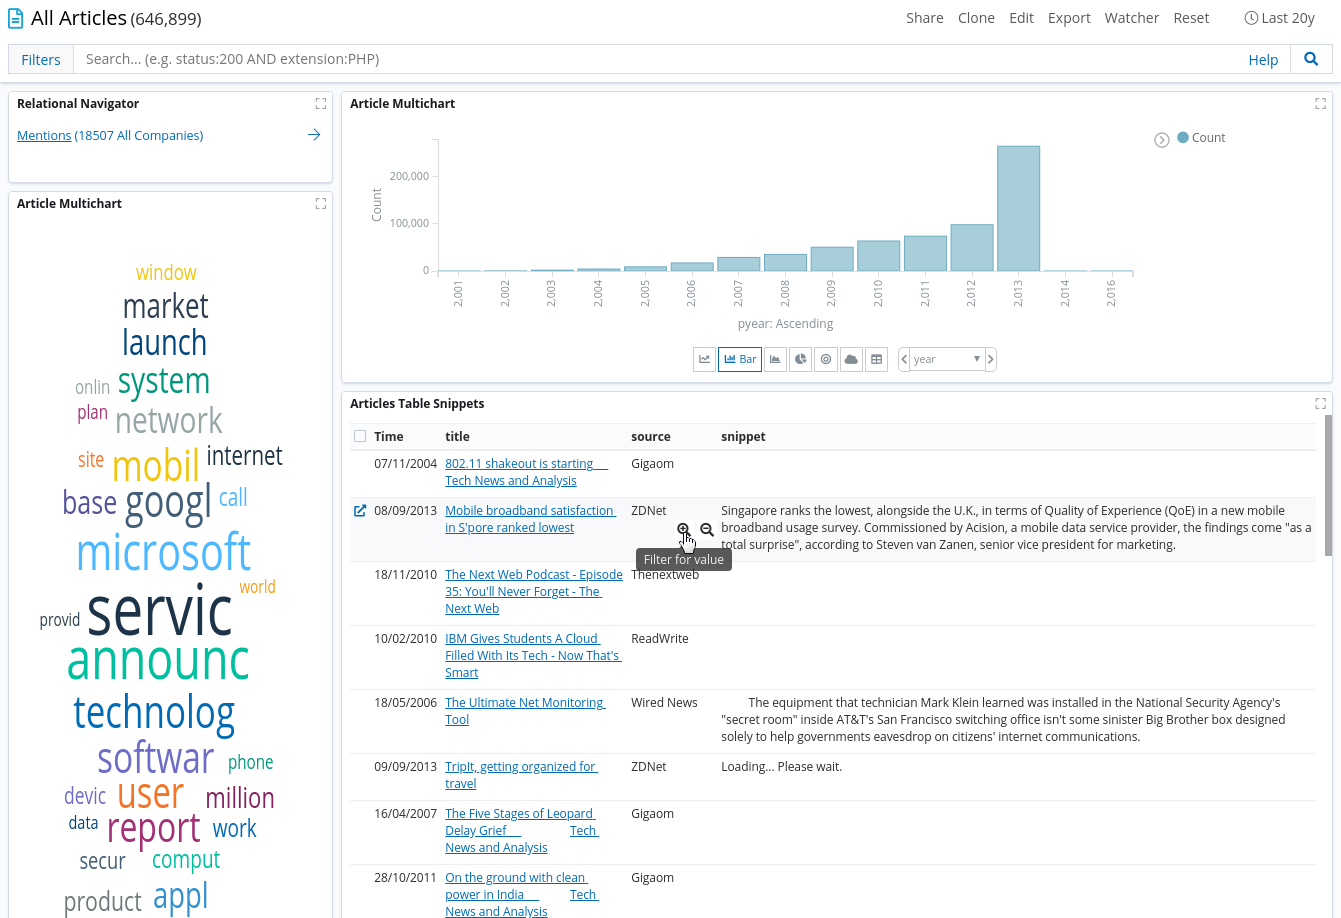
You can analyze the details of any record by clicking the button at the start of the row, which opens a floating record view panel. When a Record Table is created, you can control several aspects of the table, such as its structure, behavior, and appearance. Alternatively, you can apply a template to completely customize the records view.
Configuring Record Tables
When you create a Record Table visualization, you can configure the table by enabling or disabling a range of options.
Formatting cells
You can customize the appearance and behavior of column cells by applying cell formatters.
Click Add cell formatter, then select the column and choose the type of formatting that you want to apply.
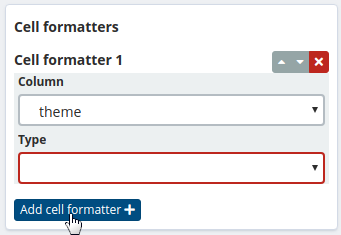
Formatting with tags
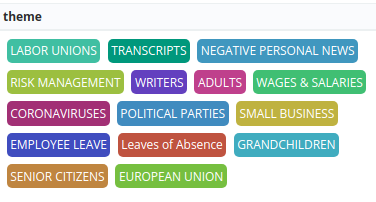
If any of the fields contain array values, you can apply tags to those fields. The cell displays each value in the array in a different colored tag. You can then filter the data by a specific array value by clicking the relevant tag.
Formatting with Natural Language Processing (NLP)
You can apply the NLP cell formatter to text fields to display the NLP annotations that are stored
inside another field. The formatted cell displays NLP annotations as highlights
on top of the text.

To configure an NLP cell formatter, you must set the following parameters:
-
Annotations field: Select the object field that contains NLP annotations for the field that you are formatting. The annotations are produced by external NLP software. The annotations object must include keys that represent annotation types, such as organization, and values that are arrays of objects that contain all the annotation data for that annotation type. These annotation data objects must contain three fields:
-
start: A numeric field that contains an offset position for the start of the annotation.
-
end: A numeric field that contains an offset position for the end of the annotation.
-
norm: A field that contains a normalized value or unique identifier for the entity that is represented by the annotated text. You can modify the name of this field by using the Annotations nested tags field parameter (see below).
The following example shows the annotation objects "organization" and "location" and the associated NLP annotations:
{
  "organization": [
    { "start": 0, "end": 11, "norm": "adventspace" },
    { "start": 31, "end": 41, "norm": "adventspace" }
  ],
  "location": [
    { "start": 84, "end": 92, "norm": "new_york" },
    { "start": 31, "end": 41, "norm": "usa" }
  ]
}
-
-
Annotations nested tags field: The name of the field inside an annotation object that contains a normalized value or a unique identifier for the entity that is represented by the annotation.
-
Available annotation types: The list of known types that you can assign when you are editing annotations.
-
Condensed offsets: Select this checkbox to store the NLP annotation offsets (or positions in text) in a condensed form. The start and end fields must be arrays of integers; one array for each mention of the entity. The following example shows the annotation object "organization" with its associated NLP annotations in a condensed format:
{
  "organization": [
    { "start": [0, 31], "end": [11, 41], "norm": "adventspace" },
  ],
  "location": [
    { "start": [84], "end": [92], "norm": "new_york" },
    { "start": [111], "end": [115], "norm": "usa" }
  ]
}
Formatting with click handlers
You can select one of the following actions to trigger when a cell is clicked:
-
Open a URL.
-
Trigger a scripting event.
Open a URL
The Follow the URL option opens a new window to a URL that is stored in an index field.
To configure a click handler, you must set the following parameters:
-
Column: The name of the column to which the handler will be bound.
-
On click I want to: Select Follow the URL.
-
URL field: The name of the field that contains the URL.
-
URL format: A custom format string to compose the URL, where @URL@ is replaced with the value of the field that you select in URL field.
You can use the URL format to create a dynamic URL. The following image shows a configuration in which the value of the id field is used to define the path of a URL on example.org.
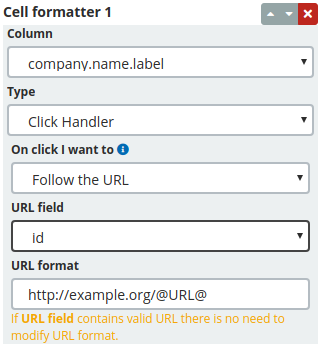
If this configuration is used, and the id field is set to 11, the resulting URL will be http://example.org/11.
Trigger a scripting event
Select the Trigger scripting event action if you want to emit an event that can trigger Siren API scripts. To configure an event, set the following parameters:
-
Column: The name of the column to which the handler will be bound.
-
On click I want to: Select Trigger scripting event.
-
Event ID: A unique identifier that allows Siren API scripts to determine the origin of the event.
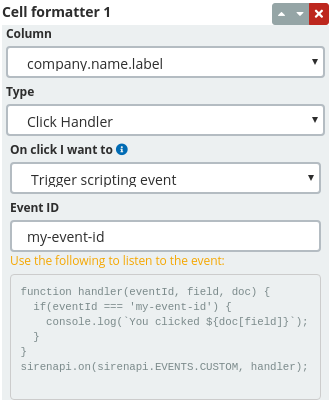
You can then use this action in any Siren API script that is associated with the dashboard to listen to the event.
For example, specify the following code in the script:
function handler(eventId, field, doc) {
  if(eventId === 'my-event-id') {
    console.log(`You clicked ${doc[field]}`);
  }
}
sirenapi.on(sirenapi.EVENTS.CUSTOM, handler);
For a more in-depth example of how to create a script for click handlers, see Using a custom template.
Customizing columns
You can specify an alias for each column or specify a column’s minimum width.
To enable renaming columns, select the Customize columns check box.
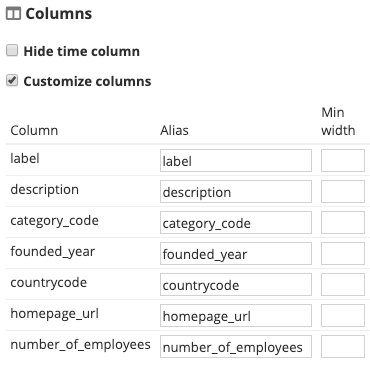
To configure the names of columns, you can set the following parameters:
-
Alias (required): An alias that is displayed as a column name.
-
Min width (optional): The minimum width of the column.
Search engine look
In a search engine, records are typically not shown before a query is entered. Selecting Search engine look replicates this behavior in the Record Table visualization.

When this option is selected, the visualization displays the message, "To start your search, enter a query, set a filter, or change the time range.".
Setting the page size
You can customize the pagination details of the Record Table.

In the Page size field, you can specify the number of records that are displayed on each page.
Using a custom template
| Custom templates have been deprecated and will be removed in a future release. Use cell formatters or templated columns instead. |
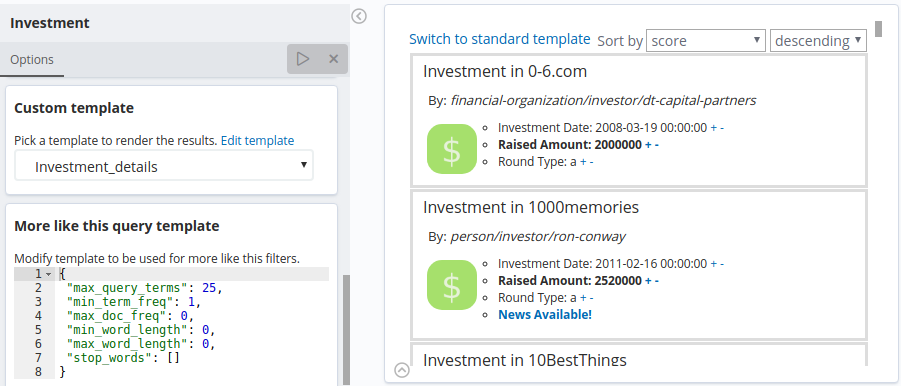
In the Custom template section, you can select a saved template to enhance the appearance of the records.
Before you can do so, you must create a template by following the instructions in Templates.
In addition to the standard html-angular directives, such as ng-click or ng-repeat, you can use the following functions in your template:
-
Function A:
filter(FIELD_NAME, FIELD_VALUE, '+'|'-')Creates a positive or negative filter for a field when a user clicks on an element. For example, to program the function for the field calledtitle, specify the following code in your script:ng-click="filter('title', hit._source['title'], '+')" ng-click="filter('title', hit._source['title'], '-')" -
Function B:
executeDefinedClickHandler(hit, FIELD_NAME)For example, to trigger the click handler that is configured for the fieldtitlewhen a user clicks on an element, specify the following code in your script:ng-click="executeDefinedClickHandler(hit, 'title')" -
Function C:
indexPattern.formatField(hit, 'FIELD_NAME')`For example, to inject a formatted field value into your template, specify the following code in your script:<div ng-bind-html="indexPattern.formatField(hit, 'title') | trustAsHtml"></div>
To see how the functions can be applied, see the sample html-angular template below:
-->
<!DOCTYPE html>
<div style="word-wrap: break-word;">
  <div ng-repeat="hit in hits|limitTo:limit track by hit._index+hit._id+hit._score" class="snippet"
    style="width: 99%; border:1px #ddd solid; margin: 4px; padding: 4px; float: left">
    <h4 style="margin: 10px" ng-if="hit._source.title">
      <div ng-bind-html="indexPattern.formatField(hit, 'title') | trustAsHtml"></div>
    </h4>
    <table>
      <tr>
        <th style="text-align: right; padding: 4px;">Property</th>
        <th style="padding: 4px;">Value</th>
      </tr>
      <tr ng-repeat="(key, value) in hit._source" ng-if="value !== null && value !== undefined && value !== ''">
        <td style="width: 150px; font-weight: bold; vertical-align: top; text-align: right; padding: 4px;">
          {{::key}}:
        </td>
        <td style="padding: 4px;">
          <a style="text-decoration: none" ng-click="filter(key, hit._source[key], '+' )">+</a>
			    <a style="text-decoration: none" ng-click="filter(key, hit._source[key], '-' )">-</a>
			    <span ng-click="executeDefinedClickHandler(hit, key)">{{::value}}</span>
        </td>
      </tr>
    </table>
  </div>
</div>
<div style="clear: both;"></div>
After you select a saved template, you can edit it by clicking Edit template.
Filtering data in a record table
For information about filtering data, see Filtering data in a dashboard.
Column header context menu
To customize a table’s columns, click the column header to open the context menu.
Sorting columns: By default, the columns are sorted in descending order by the record’s score. As long as the column is sortable, you can change the table’s sorting order to ascending or back to descending.
Fields can be sortable or unsortable depending on their data type and Elasticsearch mapping. For example, Geo Point fields have two coordinates, so sorting them in a single ordered list is not practical without additional assumptions. String fields with the text data type are tokenized during ingestion and therefore cannot be meaningfully sorted either, unless they are associated to a keyword multi-field.
|
Moving columns: You can move the selected column left or right in the table.
Setting column visibility: To hide the selected column from the table, select Hide column. You can use the Visible columns sub-menu to edit the columns that are visible in the table and each row has a switch for toggling column visibility. To find a specific column, use the search box below the header.
Templated columns
You can have extra columns rendered using perspectives defined by Template scripts. Templated columns make it possible to display custom cells on each table row. For example, you can use them to show complex calculations or prepare downloadable reports.
To use it, you should first associate the perspectives to the entity table or child search using the Table visualization section of the Template scripts tab.
If you expect more than one entity table or child search to appear on the Record Table, you can select them and assign perspectives to each.
To add the templated column to the table:
-
Go to the Templated columns tab on the visualization editing section and click Add templated column.
-
Enter a unique name for the column you want to add by editing the Column’s header field. The name must be different from the other columns already registered in the table.
-
Select the entity table or child search you want to display data for and assign a perspective to it. If you expect the. Record Table to represent more than one entity table or child search, you can add additional entity table and perspective configurations by clicking the Add perspective button in the same column configuration panel.
-
Click the play button to see the changes. The viewable perspective will render inside the cells of the new column. If the perspective type is binary, download buttons appear in each cell of the column.
-
Save the visualization to make the changes permanent.
For step-by-step instructions on how to create templates and downloadable reports see templating and reporting.
For more information about managing and editing of Template scripts, see Template scripts.