Alerting how to
This section provides solutions for common Siren Alert scenarios.
Manual in dashboard
To display Siren Alert alarms in Siren Investigate:
-
Switch to
Discovertab. -
Create and Save a search table for
watcher_alarms-*with any desired column. -
Switch to
Dashboardtab. -
Add a new Search Widget using the
Searchtab and selecting the saved query.
Query aggregations watcher for Nagios NRDP
In this example we will configure a Siren Alert Watcher to stream statuses to an extermal Nagios NRDP endpoint.
Query request
Let’s run an aggregation query in Sense to find low MOS groups in the last five minutes interval:
GET _search
{
  "query": {
    "filtered": {
      "query": {
        "query_string": {
          "query": "tab:mos",
          "analyze_wildcard": true
        }
      },
      "filter": {
        "bool": {
          "must": [
            {
              "range": {
                "@timestamp": {
                  "gte": "now-5m",
                  "lte": "now"
                }
              }
            },
            {
              "range" : {
                "value" : {
                  "lte" : 3
                }
              }
            }
          ],
          "must_not": []
        }
      }
    }
  },
  "size": 0,
  "aggs": {
    "mos": {
      "date_histogram": {
        "field": "@timestamp",
        "interval": "30s",
        "time_zone": "Europe/Berlin",
        "min_doc_count": 1
      },
      "aggs": {
        "by_group": {
          "terms": {
            "field": "group.raw",
            "size": 5,
            "order": {
              "_key": "desc"
            }
          },
          "aggs": {
            "avg": {
              "avg": {
                "field": "value"
              }
            }
          }
        }
      }
    }
  }
}
Query response
The response should look similar to this example. Let’s analyze the data structure:
{
  "took": 5202,
  "timed_out": false,
  "_shards": {
    "total": 104,
    "successful": 104,
    "failed": 0
  },
  "hits": {
    "total": 3,
    "max_score": 0,
    "hits": []
  },
  "aggregations": {
    "mos": {
      "buckets": [
        {
          "key_as_string": "2016-08-02T13:41:00.000+02:00",
          "key": 1470138060000,
          "doc_count": 2,
          "by_group": {
            "doc_count_error_upper_bound": 0,
            "sum_other_doc_count": 0,
            "buckets": [
              {
                "key": "domain1.com",
                "doc_count": 2,
                "avg": {
                  "value": 1.85
                }
              }
            ]
          }
        },
        {
          "key_as_string": "2016-08-02T13:42:00.000+02:00",
          "key": 1470138120000,
          "doc_count": 1,
          "by_group": {
            "doc_count_error_upper_bound": 0,
            "sum_other_doc_count": 0,
            "buckets": [
              {
                "key": "domain2.com",
                "doc_count": 1,
                "avg": {
                  "value": 2.81
                }
              }
            ]
          }
        }
      ]
    }
  }
}
Watcher query
Next let’s use Sense to create a custom Siren Alert Watcher based on the
query and its response, using mustache syntax to loop trough the
aggregation buckets and extracting grouped results in an XML
structure accepted by Nagios:
PUT _watcher/watch/low_mos
{
  "metadata": {
    "mos threshold": 3
  },
  "trigger": {
    "schedule": {
      "interval": "5m"
    }
  },
  "input": {
    "search": {
      "request": {
        "indices": [
          "<pcapture_*-{now/d}>"
        ],
        "body": {
          "size": 0,
          "query": {
            "filtered": {
              "query": {
                "query_string": {
                  "query": "tab:mos",
                  "analyze_wildcard": true
                }
              },
              "filter": {
                "bool": {
                  "must": [
                    {
                      "range": {
                        "@timestamp": {
                          "gte": "now-5m",
                          "lte": "now"
                        }
                      }
                    },
                    {
                      "range": {
                        "value": {
                          "lte": 3
                        }
                      }
                    }
                  ],
                  "must_not": []
                }
              }
            }
          },
          "aggs": {
            "mos": {
              "date_histogram": {
                "field": "@timestamp",
                "interval": "30s",
                "time_zone": "Europe/Berlin",
                "min_doc_count": 1
              },
              "aggs": {
                "by_group": {
                  "terms": {
                    "field": "group.raw",
                    "size": 5,
                    "order": {
                      "_key": "desc"
                    }
                  },
                  "aggs": {
                    "avg": {
                      "avg": {
                        "field": "value"
                      }
                    }
                  }
                }
              }
            }
          }
        }
      }
    }
  },
  "condition": {
     "script": {
        "script": "payload.hits.total > 1"
     }
  },
  "actions" : {
  "my_webhook" : {
    "throttle_period" : "5m",
    "webhook" : {
      "method" : "POST",
      "host" : "nagios.domain.ext",
      "port" : 80,
      "path": ":/nrdp",
      "body" : "token=TOKEN&cmd=submitcheck&XMLDATA=<?xml version='1.0'?><checkresults>{{#ctx.payload.aggregations.mos.buckets}} <checkresult type='host' checktype='1'>{{#by_group.buckets}}<hostname>{{key}}</hostname><servicename>MOS</servicename><state>0</state><output>MOS is {{avg.value}}</output> {{/by_group.buckets}}</checkresult>{{/ctx.payload.aggregations.mos.buckets}}</checkresults></xml>"
    }
  }
}
}
Action Body (mustache generated)
<?xml version='1.0'?>
<checkresults>
<checkresult type='host' checktype='1'>
<hostname>domain1.com</hostname><servicename>MOS</servicename><state>0</state><output>MOS is 1.85</output> </checkresult>
<checkresult type='host' checktype='1'>
<hostname>domain2.com</hostname><servicename>MOS</servicename><state>0</state><output>MOS is 2.81</output> </checkresult>
</checkresults>
</xml>
Mustache playground
A simple playground simulating this response and output is available from http://jsfiddle.net/Lyfoq6yw/.
Reports
Siren Alert watchers can generate snapshots of Siren Investigate (or any other website)
and deliver them on your schedule using the dedicated report action, powered by Puppeteer.
This example enables you to produce weekly charts.
{
  "_index": "watcher",
  "_id": "reporter_v8g6p5enz",
  "_score": 1,
  "_source": {
    "trigger": {
      "schedule": {
        "later": "on the first day of the week"
      }
    },
    "report": true,
    "actions": {
      "report_admin": {
        "report": {
          "to": "reports@localhost",
          "from": "sirenalert@localhost",
          "subject": "Siren Alert Report",
          "priority": "high",
          "body": "Sample Siren Alert Screenshot Report",
          "snapshot": {
            "res": "1280x900",
            "url": "http://www.google.com",
            "params": {
              "delay": 5000
            }
          }
        }
      }
    }
  }
}
Requirements
| Chromium is included in the Linux version of Siren Alert. |
You can download Chromium
(https://www.chromium.org/getting-involved/download-chromium) and change
the sentinl.settings.report.puppeteer.browser_path to point to it, for
example:
sentinl:
  settings:
    email:
      active: true
      host: 'localhost'
      #cert:
      #key: '/home'
    report:
      active: true
      puppeteer:
        browser_path: '/usr/bin/chromium'
When report actions are correctly configured, you will soon receive your first report with a screen shot attached.
Spy plugin
Siren Alert features an integrated Siren Investigate/Kibana plugin extending the default Spy functionality to help users quickly shape new prototype Watchers based on Visualize queries, and providing them to Siren Alert for fine editing and scheduling.
Annotations
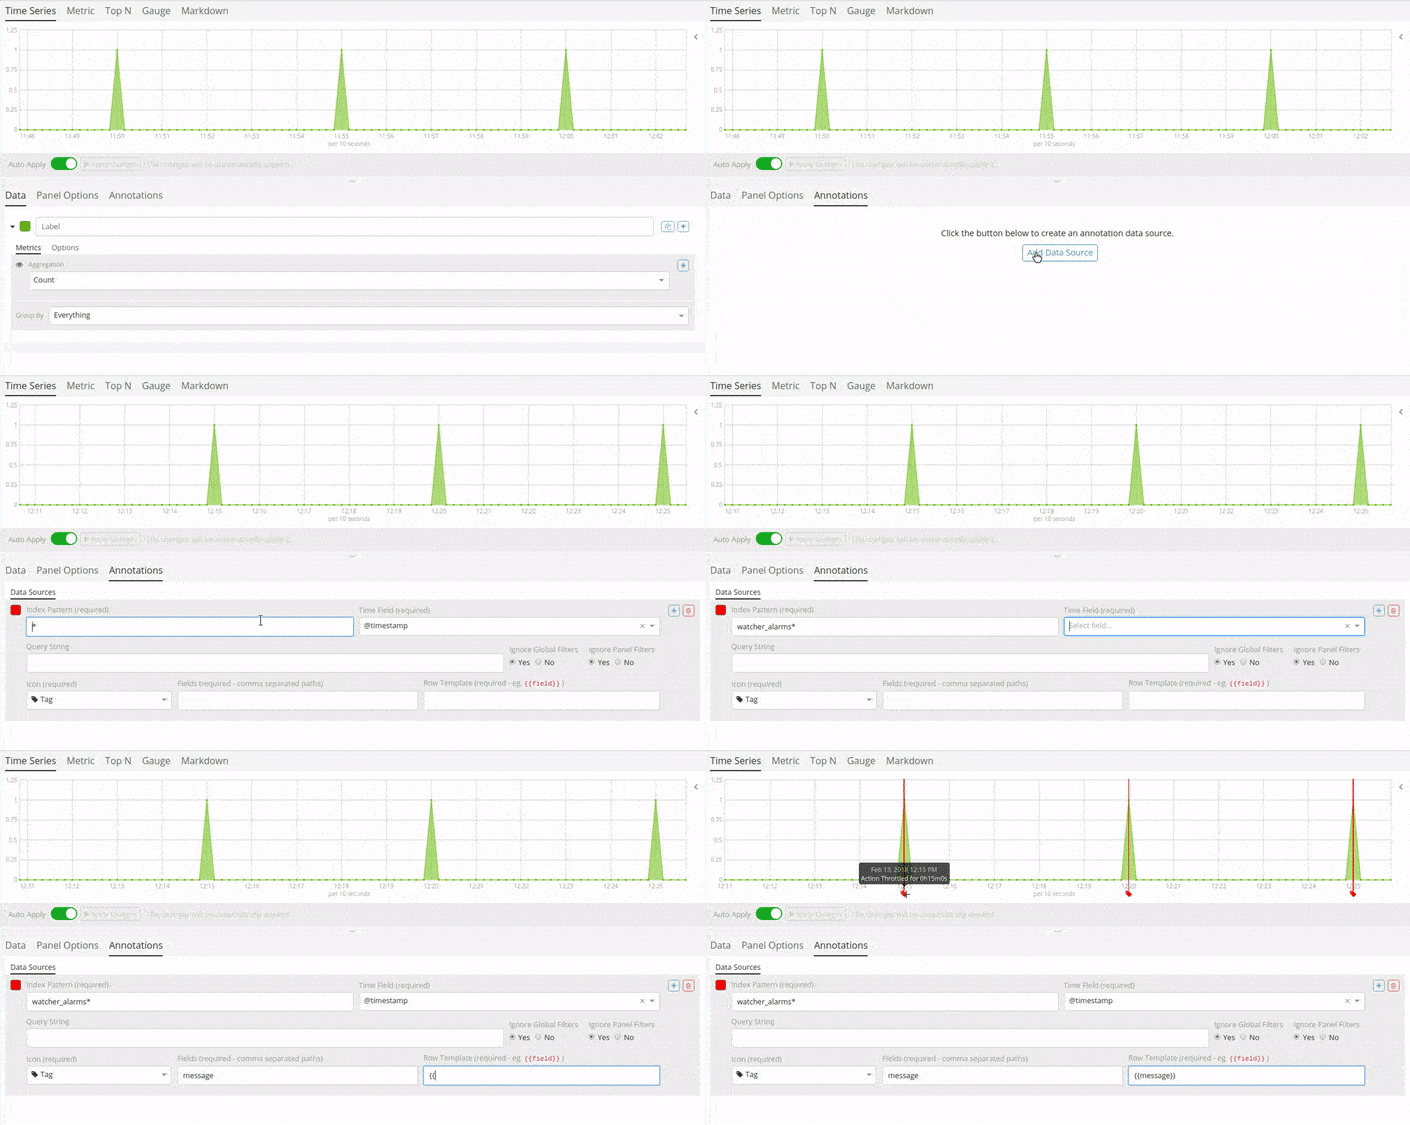
Siren Alert alerts and detections can be superimposed over
visualizations widgets using the Annotations feature in Kibana 5.5+
revealing points of contact and indicators in real-time. The familiar
mustache syntax is utilized to render row elements from the alert
based on case requirements.
How to
Follow this procedure to enable Siren Alert Annotations over your data:
-
Visualize your time series using the Query Builder widget.
-
Switch to the Annotations tab.
-
Go to .
-
Select the Index and Timefield for Siren Alert.
-
Index Pattern:
watcher_alerts*. -
Time Field:
@timestamp. -
Select the Field to Display in Annotations.
-
Fields:
message. -
Row Template:
{{ message }}.
Transform
Anomaly detection
The Siren Alert anomaly detection mechanism is based on the three-sigma rule. In short, anomalies are the values which lie outside a band around the mean in a normal distribution with a width of two, four and six standard deviations (68.27%, 95.45% and 99.73%).
-
Create a new watcher.
-
In watcher editor, inside
Inputtab insert Elasticsearch query to get the credit card transactions data set.{ "search": { "request": { "index": [ "credit_card" ], "body": { "size": 10000, "query": { "bool": { "must": [ { "exists": { "field": "Amount" } } ] } } } } } } -
In the
Conditiontab specify a minimum number of results to look forpayload.hits.total > 0and a field name in which to look for anomalies,Amountin our example.{ "script": { "script": "payload.hits.total > 0" }, "anomaly": { "field_to_check": "Amount" } } -
In
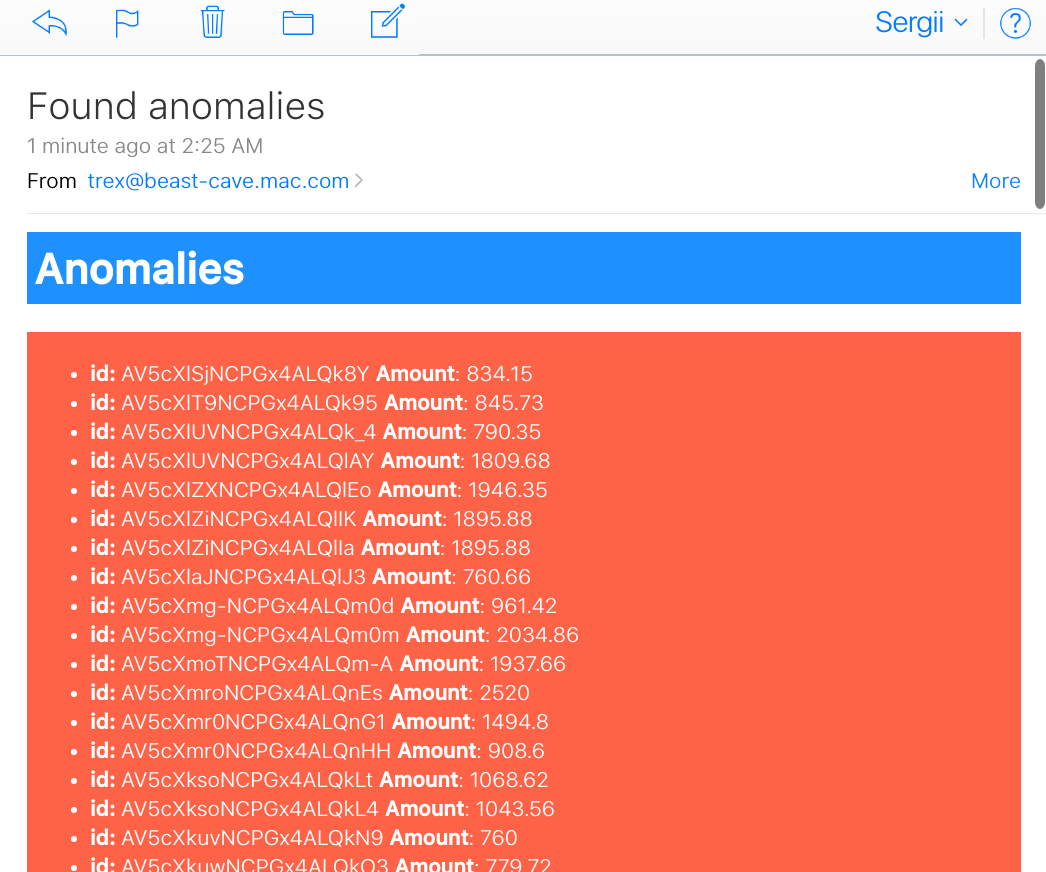
Actiontab createemail htmlaction. InBody HTML fieldrender all the anomalies you have in thepayload.anomalyusing mustache syntax.<h1 style="background-color:DodgerBlue;color:white;padding:5px">Anomalies</h1> <div style="background-color:Tomato;color:white;padding:5px"> <ul> {{#payload.anomaly}} <li><b>id:</b> {{_id}} <b>Amount</b>: {{_source.Amount}}</li> {{/payload.anomaly}} </ul> </div>
As a result, we have an email with a list of anomaly transactions.

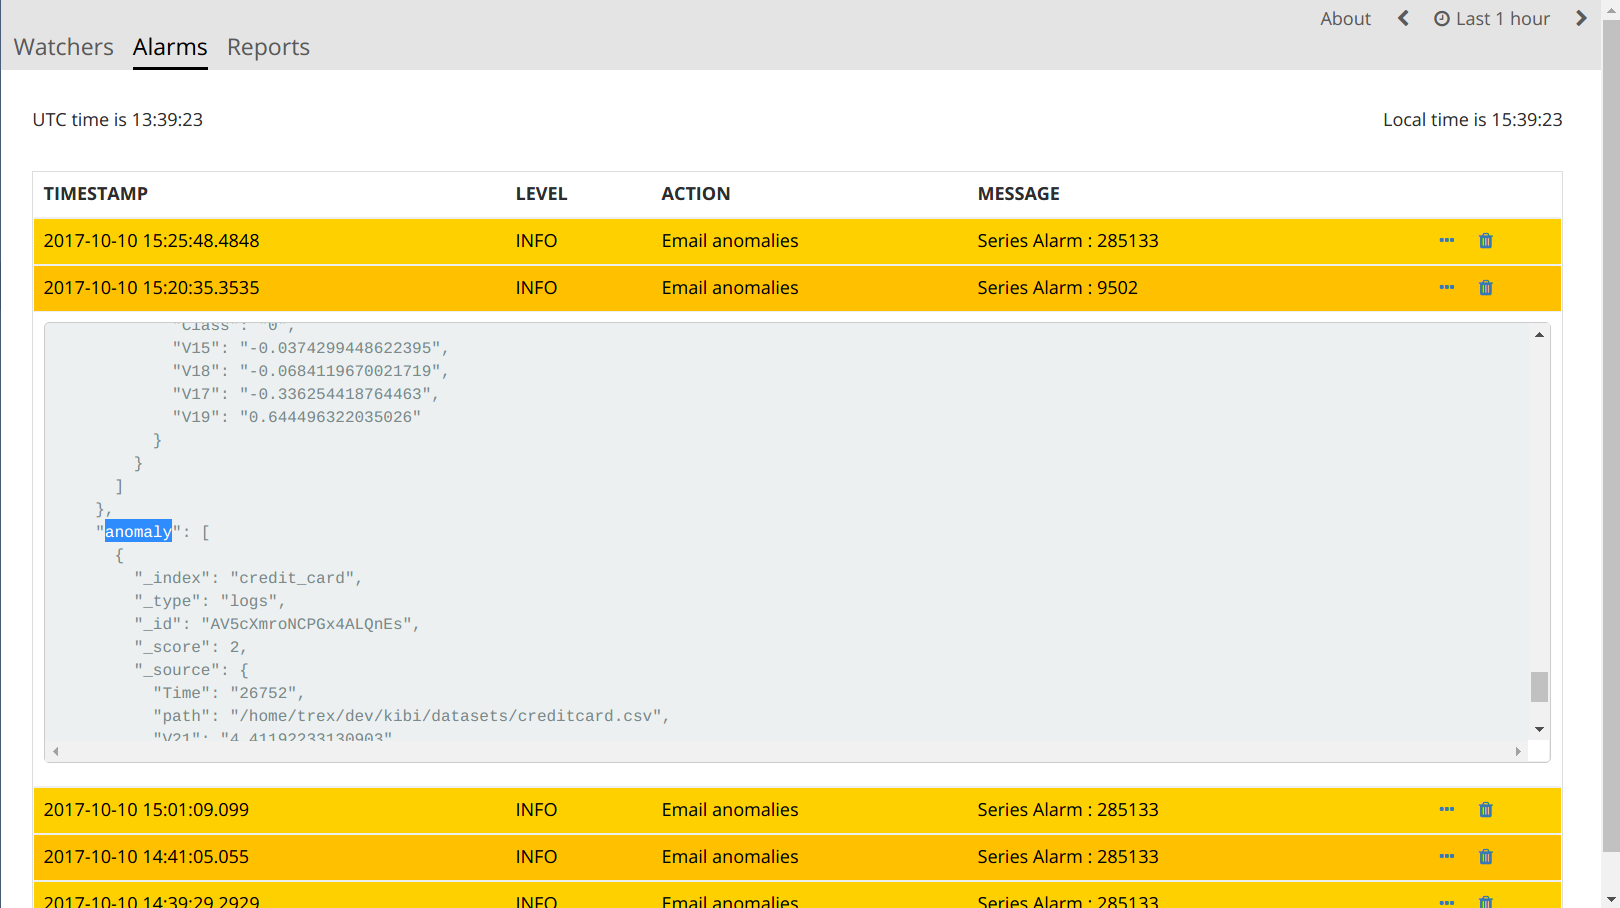
Also, the list of anomalies was indexed in today’s alert index
watcher_alarms-{year-month-date}.

Statistical anomaly detection
In this example, we will implement the ATLAS statistical anomaly detector using Siren Alert:
-
We have a varnish-cache server as Frontend-LB and caching proxy.
-
The backends are selected based on their
first_url_part. -
Backends are dynamically added or removed by our development teams (even new applications).
If we look at the 95th percentile of our consolidated backend run times we cannot see problems of a special backend service. If we draw a graph for every service, it will be too much to see a problem.
To solve this, we will implement the atlas algorithm. To do this we need two watchers:
-
The first collects a
req_runtimeof every backend for every hour. -
The second iterates every five minute over the atlas index to find anomalies to report.
First watcher
This watcher will collect a most surprising req_runtime of every
backend for every hour, and insert any results in the atlas index
(using webhook and _bulk).
{
  "_index": "watcher",
  "_id": "surprise",
  "_score": 1,
  "_source": {
    "trigger": {
      "schedule": {
        "later": "every 1 hours"
      }
    },
    "input": {
      "search": {
        "request": {
          "index": "public-front-*",
          "body": {
            "query": {
              "filtered": {
                "filter": {
                  "range": {
                    "@timestamp": {
                      "gte": "now-24h"
                    }
                  }
                }
              }
            },
            "size": 0,
            "aggs": {
              "metrics": {
                "terms": {
                  "field": "first_url_part"
                },
                "aggs": {
                  "queries": {
                    "terms": {
                      "field": "backend"
                    },
                    "aggs": {
                      "series": {
                        "date_histogram": {
                          "field": "@timestamp",
                          "interval": "hour"
                        },
                        "aggs": {
                          "avg": {
                            "avg": {
                              "script": "doc['req_runtime'].value*1000",
                              "lang": "expression"
                            }
                          },
                          "movfn": {
                            "moving_fn": {
                              "buckets_path": "avg",
                              "window": 24,
                              "script": "MovingFunctions.unweightedAvg(values)"
                            }
                          },
                          "surprise": {
                            "bucket_script": {
                              "buckets_path": {
                                "avg": "avg",
                                "movavg": "movavg"
                              },
                              "script": {
                                "file": "surprise",
                                "lang": "groovy"
                              }
                            }
                          }
                        }
                      },
                      "largest_surprise": {
                        "max_bucket": {
                          "buckets_path": "series.surprise"
                        }
                      }
                    }
                  },
                  "ninetieth_surprise": {
                    "percentiles_bucket": {
                      "buckets_path": "queries>largest_surprise",
                      "percents": [
                        90.01
                      ]
                    }
                  }
                }
              }
            }
          }
        }
      }
    },
    "condition": {
      "script": {
        "script": "payload.hits.total > 1"
      }
    },
    "transform": {
      "script": {
        "script": "payload.aggregations.metrics.buckets.forEach(function(e){ e.ninetieth_surprise.value = e.ninetieth_surprise.values['90.01']; e.newts = new Date().toJSON(); })"
      }
    },
    "actions": {
      "ES_bulk_request": {
        "throttle_period": "1m",
        "webhook": {
          "method": "POST",
          "host": "myhost",
          "port": 80,
          "path": "/_bulk",
          "body": "{{#payload.aggregations.metrics.buckets}}{\"index\":{\"_index\":\"atlas\"}}\n{\"metric\":\"{{key}}\", \"value\":{{ninetieth_surprise.value}}, \"execution_time\":\"{{newts}}\"}\n{{/payload.aggregations.metrics.buckets}}",
          "headers": {
            "content-type": "text/plain; charset=ISO-8859-1"
          }
        }
      }
    }
  }
}
The transform script makes the 90th value of every bucket accessible for mustache and generates a NOW timestamp. The action writes the relevant values back to a separate index named atlas.
Second watcher
The second watcher iterates every five minutes over the atlas index to find anomalies to report:
{
  "_index": "watcher",
  "_id": "check_surprise",
  "_score": 1,
  "_source": {
    "trigger": {
      "schedule": {
        "later": "every 5 minutes"
      }
    },
    "input": {
      "search": {
        "request": {
          "index": "atlas",
          "body": {
            "query": {
              "filtered": {
                "filter": {
                  "range": {
                    "execution_time": {
                      "gte": "now-6h"
                    }
                  }
                }
              }
            },
            "size": 0,
            "aggs": {
              "metrics": {
                "terms": {
                  "field": "metric"
                },
                "aggs": {
                  "series": {
                    "date_histogram": {
                      "field": "execution_time",
                      "interval": "hour"
                    },
                    "aggs": {
                      "avg": {
                        "avg": {
                          "field": "value"
                        }
                      }
                    }
                  },
                  "series_stats": {
                    "extended_stats": {
                      "field": "value",
                      "sigma": 3
                    }
                  }
                }
              }
            }
          }
        }
      }
    },
    "condition": {
      "script": {
        "script": "var status=false;payload.aggregations.metrics.buckets.forEach(function(e){ var std_upper=parseFloat(e.series_stats.std_deviation_bounds.upper); var avg=parseFloat(JSON.stringify(e.series.buckets.slice(-1)[0].avg.value)); if(isNaN(std_upper)||isNaN(avg)) {return status;}; if(avg > std_upper) {status=true; return status;};});status;"
      }
    },
    "transform": {
      "script": {
        "script": "var alerts=[];payload.payload.aggregations.metrics.buckets.forEach(function(e){ var std_upper=parseFloat(e.series_stats.std_deviation_bounds.upper); var avg=parseFloat(JSON.stringify(e.series.buckets.slice(-1)[0].avg.value)); if(isNaN(std_upper)||isNaN(avg)) {return false;}; if(avg > std_upper) {alerts.push(e.key)};}); payload.alerts=alerts"
      }
    },
    "actions": {
      "series_alarm": {
        "throttle_period": "15m",
        "email": {
          "to": "alarms@email.com",
          "from": "sirenalert@localhost",
          "subject": "ATLAS ALARM Varnish_first_url_part",
          "priority": "high",
          "body": "there is an alarm for the following Varnish_first_url_parts:{{#alerts}}{{.}}<br>{{/alerts}}"
        }
      }
    }
  }
}
The condition script tests whether the average run time of the last
bucket is greater than upper bound of the std_dev.
The transform script does something similar to an alerts array at the top of the payload. At the end, we alert per email (or REST POST, and so on).
Outliers
This example performs an outlier detection against a bucket of detection in one go.
Simple outlier condition (exploded)
var match=false; // false by default

payload.offenders = new Array();

payload.detections = new Array();

function detect(data){
   data.sort(function(a,b){return a-b});
   var l = data.length;
   var sum=0;
   var sumsq = 0;
   for(var i=0;i<data.length;++i){ sum+=data[i];sumsq+=data[i]*data[i];}
   var mean = sum/l;
   var median = data[Math.round(l/2)];
   var LQ = data[Math.round(l/4)];
   var UQ = data[Math.round(3*l/4)];
   var IQR = UQ-LQ;
   for(var i=0;i<data.length;++i){if(!(data[i]> median - 2 * IQR && data[i] < mean + 2 * IQR)){
      match=true; payload.detections.push(data[i]);
   }
 }
};

var countarr=[];

payload.aggregations.hits_per_hour.buckets.forEach(function(e){
  if(e.doc_count > 1) countarr.push(e.doc_count);
}); detect(countarr);

payload.aggregations.hits_per_hour.buckets.forEach(function(e){
  payload.detections.forEach(function(mat){
     if(e.doc_count == mat) payload.offenders.push(e);
  })
});

match;
Example Siren Alert watcher
{
  "_index": "watcher",
  "_id": "anomaly_runner",
  "_score": 1,
  "_source": {
    "uuid": "anomaly_runner",
    "disable": false,
    "trigger": {
      "schedule": {
        "later": "every 30 minutes"
      }
    },
    "input": {
      "search": {
        "request": {
          "body": {
            "size": 0,
            "query": {
              "filtered": {
                "query": {
                  "query_string": {
                    "analyze_wildcard": true,
                    "query": "status:8"
                  }
                },
                "filter": {
                  "bool": {
                    "must": [
                      {
                        "range": {
                          "@timestamp": {
                            "gte": "now-1h",
                            "lte": "now"
                          }
                        }
                      }
                    ],
                    "must_not": []
                  }
                }
              }
            },
            "aggs": {
              "hits_per_hour": {
                "date_histogram": {
                  "field": "@timestamp",
                  "interval": "1m",
                  "time_zone": "Europe/Berlin",
                  "min_doc_count": 1
                },
                "aggs": {
                  "top_sources": {
                    "terms": {
                      "field": "source_ip.raw",
                      "size": 5,
                      "order": {
                        "_count": "desc"
                      }
                    }
                  }
                }
              }
            }
          },
          "index": [
            "<pcapture_cdr_*-{now/d}>",
            "<pcapture_cdr_*-{now/d-1d}>"
          ]
        }
      }
    },
    "condition": {
      "script": {
        "script": "payload.detections = new Array();function detect(data){data.sort(function(a,b){return a-b});var l = data.length;var sum=0;var sumsq = 0;for(var i=0;i<data.length;++i){sum+=data[i];sumsq+=data[i]*data[i];}var mean = sum/l; var median = data[Math.round(l/2)];var LQ = data[Math.round(l/4)];var UQ = data[Math.round(3*l/4)];var IQR = UQ-LQ;for(var i=0;i<data.length;++i){if(!(data[i]> median - 2 * IQR && data[i] < mean + 2 * IQR)){ match=true; payload.detections.push(data[i]); } }}; var match=false;var countarr=[]; payload.aggregations.hits_per_hour.buckets.forEach(function(e){ if(e.doc_count > 1) countarr.push(e.doc_count); });detect(countarr);payload.aggregations.hits_per_hour.buckets.forEach(function(e){ payload.detections.forEach(function(mat){ if(e.doc_count == mat) payload.offenders.push(e); })});match;"
      }
    },
    "transform": {},
    "actions": {
      "investigate_actions": {
        "email": {
          "to": "root@localhost",
          "from": "sirenalert@localhost",
          "subject": "Series Alarm {{ payload._id}}: User Anomaly {{ payload.detections }} CDRs per Minute",
          "priority": "high",
          "body": "Series Alarm {{ payload._id}}: Anomaly Detected. Possible Offenders: {{#payload.offenders}} \n{{key_as_string}}: {{doc_count}} {{#top_sources.buckets}}\n IP: {{key}} ({{doc_count}} failures) {{/top_sources.buckets}} {{/payload.offenders}} "        }
      }
    }
  }
}