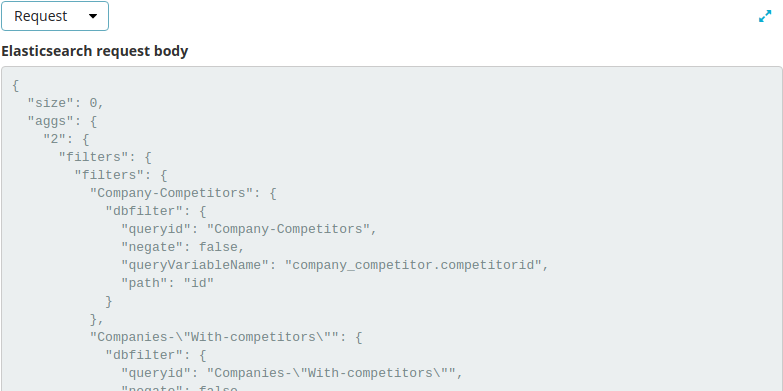
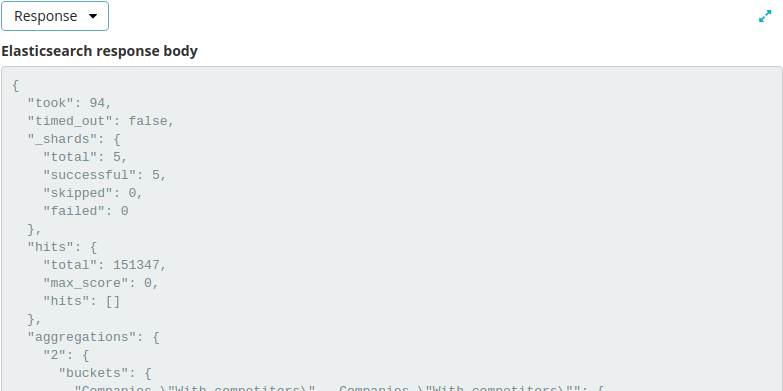
Inspecting visualizations
To display the raw data behind the visualization, hover over the visualization and click the icon
( ) in the bottom left corner of the
container.
Use the dropdown menu (highlighted below) to view detailed information about the raw data.
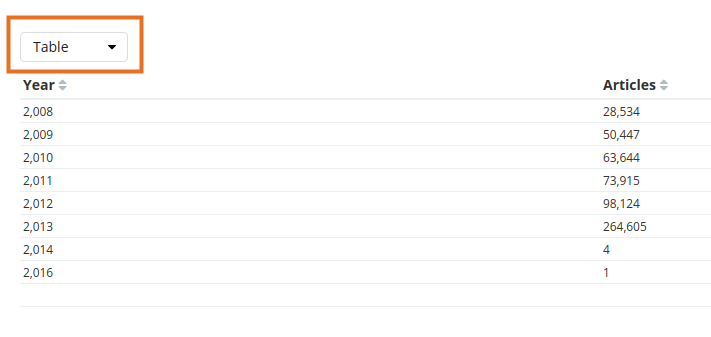
Table
A representation of the underlying data, presented as a paginated data grid. You can sort the items in the table by clicking the table headers at the top of each column.
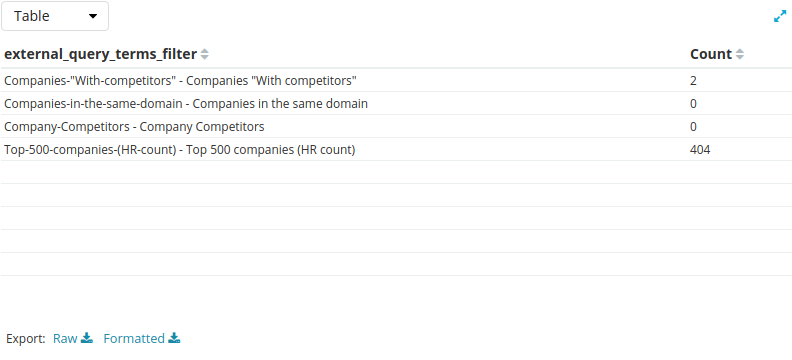
Statistics
A summary of the statistics related to the request and the response, presented as a data grid. The data grid includes the query duration, the request duration, the total number of records found on the server, and the index pattern used to make the query.

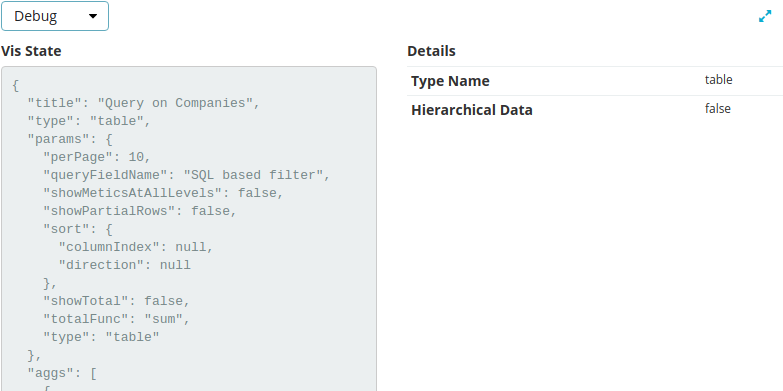
Debug
A summary of the visualization state (for example, visualization parameters and aggregations) and other details.
To export the raw data behind the visualization as a comma-separated-values (CSV) file, click either the Raw or Formatted links at the bottom of the detailed information tabs. A raw export contains the data as it is stored in Elasticsearch. A formatted export contains the results of any applicable Siren Investigate field formatters.
