Viewing nodes in a table
You can select nodes on the graph and view them in a table (grid) so that you can display, search, filter, sort, group, change node or link data and export to a CSV. In the data table, a row represents a node (record) in the graph and the columns display the fields.
To view nodes in a table, do the following:
-
Select nodes on the graph. In the bottom bar, the entity table or EID associated with the nodes appear as tabs.
-
Click a tab to open the table.
|
Choosing the columns
By default, the table displays the Selected fields listed in the data model. You can select the columns that you want to see as follows:
-
Right-click a column header and select Visible columns.
-
Select the fields you want to view as columns.
-
Optional: To quickly remove a column, right-click the column header and select Remove column.
Searching and filtering the graph nodes
You can search the nodes and then filter the graph to those nodes:
-
In a table, in Filter, enter a search term.
-
Click Search.
-
From the results, select the records you would like to see on the graph.
-
Optional: To filter the graph to show only the records you selected, click Make main selection and click Crop.
Grouping columns
You can select a field to group similar values together. For example, you could group the field founded_year to organize records by year and sort them in order. To group fields:
-
Right-click the column header of the field you want to group by.
-
Select Group column.
-
Optional: To create a node on the graph that represents a group, select the group and click Make group selection.
Displaying record fields on nodes
To display record fields under nodes on the graph:
-
Select the nodes on the graph.
-
In the selection table, hover over the field and click the Add bullet point button.
|
Local nodes

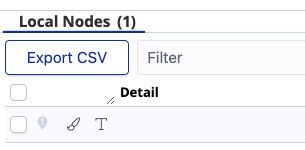
Local nodes will appear on selection table with an icon next to the checkbox. Local nodes derived from an entity type, will appear under the tab of their respective type. Local nodes that don’t have an entity type will appear under the tab Local Nodes.
Changing styles
You can change the style of nodes from the selection table, similar to how it’s done from the toolbar.
To change the style of a node:
-
In the selection table, hover over the row of the node that needs to be updated
-
Click on the Style button
-
You will be presented with the same style menus as in the toolbar
-
Optional: Click the Restore Style or the restore buttons within each style menu to revert the changes
Changing label
The label of a node can be updated from the selection table.
To change the label of a node:
-
In the selection table, hover over the row of the node that needs to be updated
-
Click on the Label button
-
Update the label in the text box popup
-
Click Save button
-
Optional: Click the Restore label to revert to the original label
Editing record fields
You can edit a field value in the selection table. The edited value appears only in the graph, it doesn’t change in the Elasticsearch document. Edited values are displayed in italics in the selection table.
To edit a field value:
-
In the selection table, hover over the field and click the Edit button.
-
Edit the name and click Save.
-
Optional: Click the Restore button to revert to the original field value.