Discover
You can explore your data interactively from the Discover page. You have access to every document in every index which matches the selected index pattern. You can submit search queries, filter the search results, and view document data. You can also see the number of documents that match the search query and get field value statistics. If a time field is configured for the selected index pattern, the distribution of documents over time is displayed in a histogram at the top of the page.
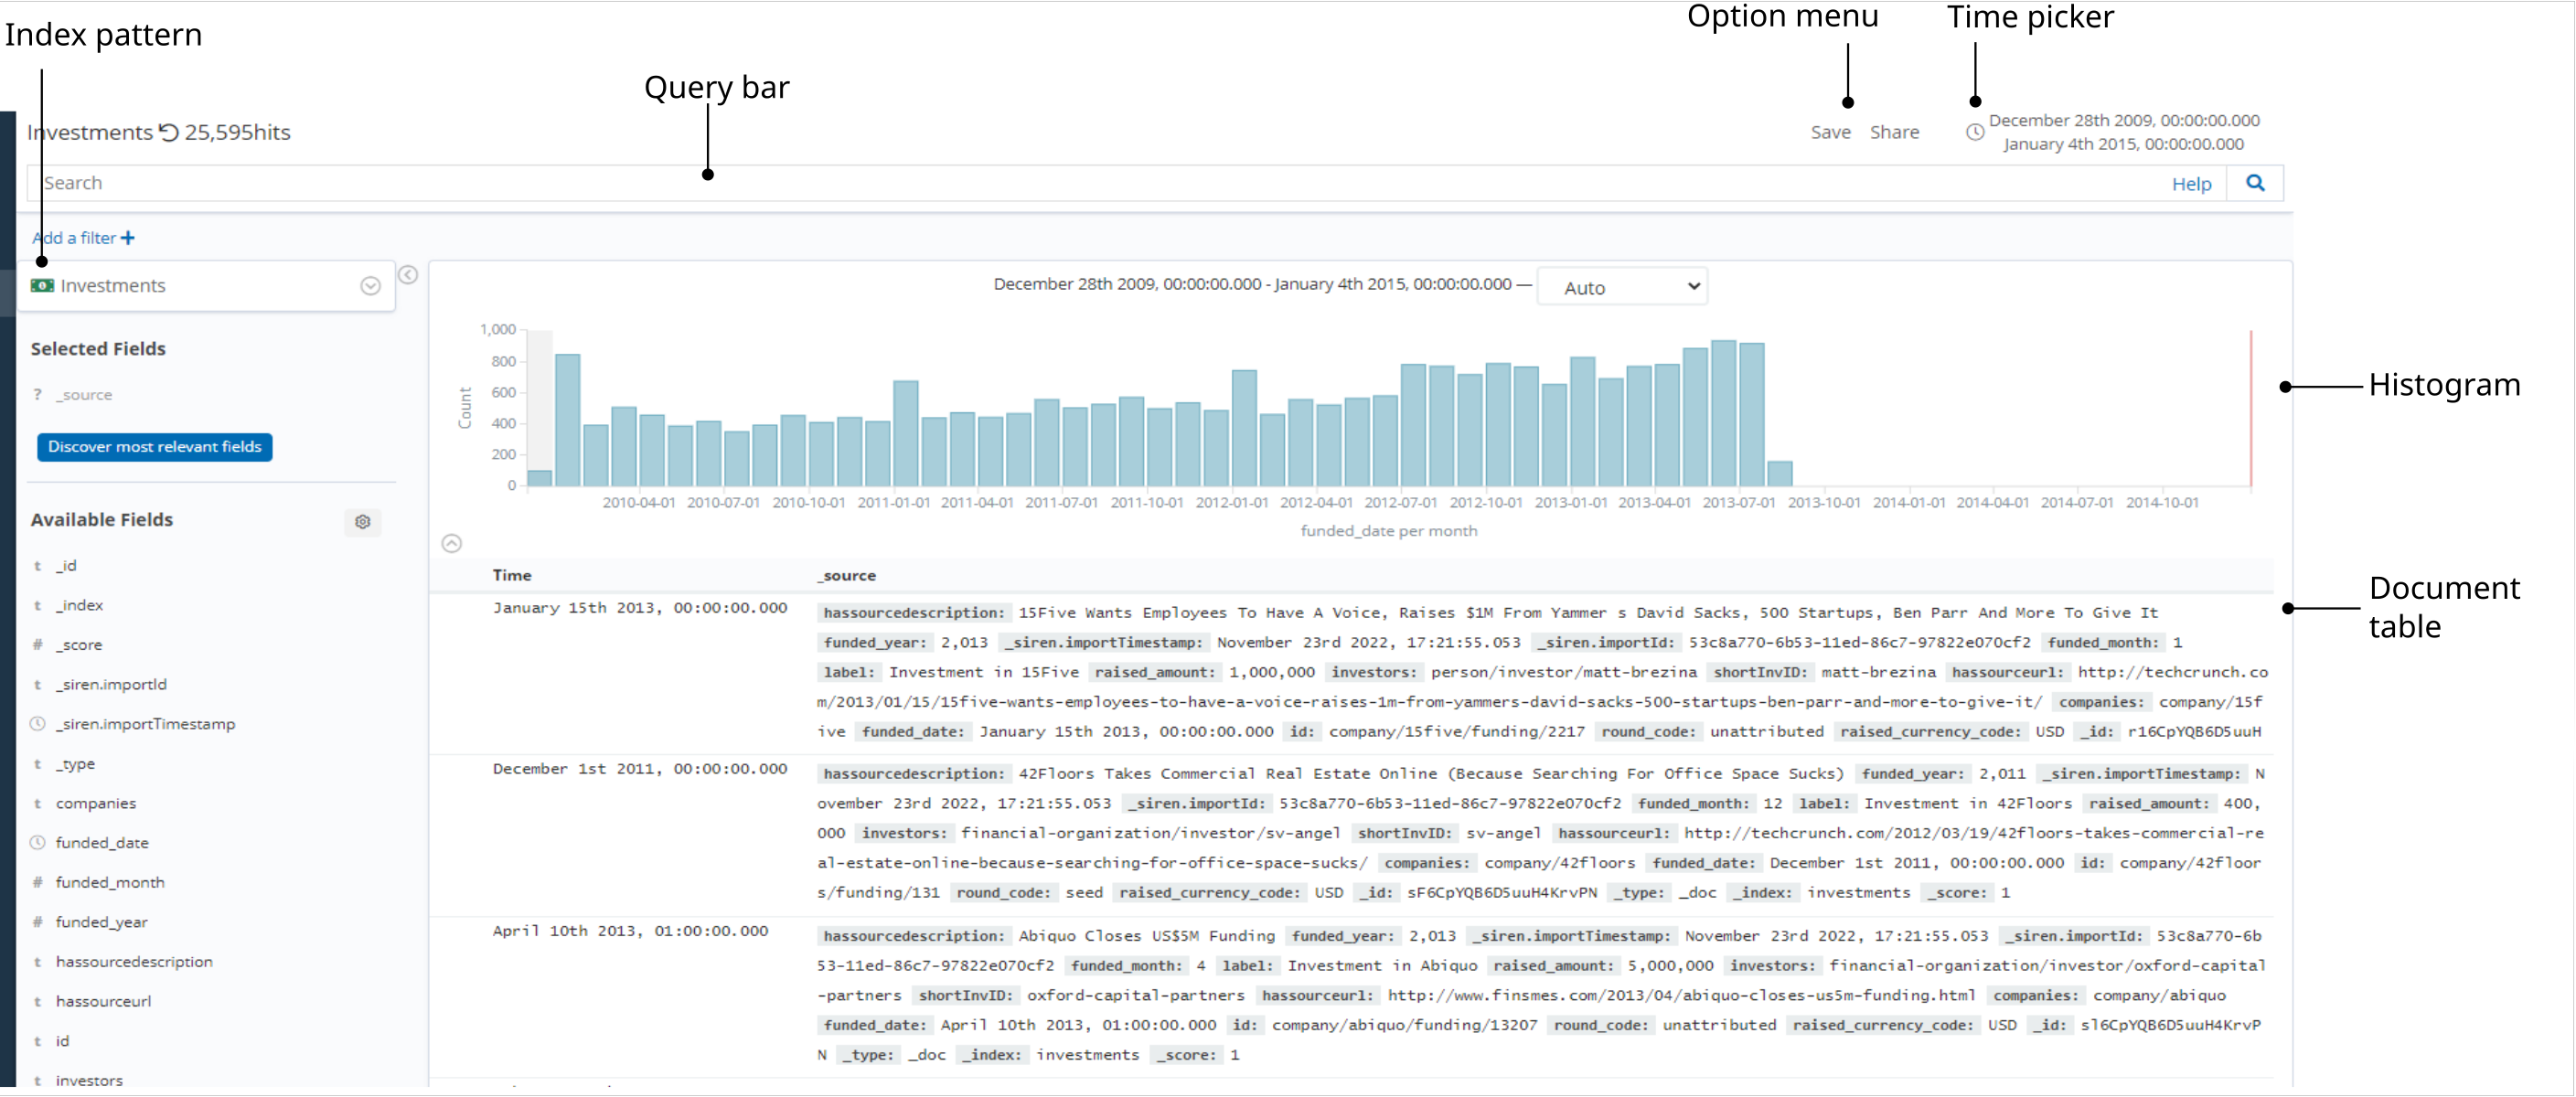
Setting a time filter on a histogram
You can set a time filter by using the methods described in the Filtering data in a dashboard topic.
You can also set a time filter on the histogram visualization in one of the following ways:
-
Click the bar that represents the time interval that you want to zoom in on.
-
Click and drag to view a specific time span. You must start the selection with the cursor over the background of the chart. The cursor changes to a plus sign (+) when you move the mouse pointer over a valid start point.
The displayed time range and interval are shown on the histogram. By default, the interval is set automatically based on the time range. To use a different interval, click the link and select an interval.
Searching your data
You can search your data by using the methods described in the Searching data in a dashboard and Filtering data in a dashboard topics.
In the Discover app, when you submit a search request, the histogram, documents table, and fields list are updated to reflect the search results and the total number of hits (matching documents) is shown in the toolbar.
The documents table shows the first five hundred hits. By default, the hits are listed in reverse chronological order, with the newest documents shown first. You can reverse the sort order by clicking the Time column header.
You can also sort the table by the values in any indexed field. For more information, see Viewing document data.
Saving a search
Saving searches allows you to use them more than once and they can also form the basis for visualizations. Saving a search saves both the search query string and the currently selected index pattern.
To save the current search:
-
From the Options menu, click Save.
-
Enter a name for the search and click Save.
You can import, export, and remove saved searches by going to the Management app and finding them in the Saved Objects screen.
Opening a saved search
To reload a saved search into Discover:
-
Click Open in the Siren Investigate toolbar.
-
Select the search you want to open.
If the saved search is associated with a different index pattern than is currently selected, opening the saved search also changes the selected index pattern.
Changing which indices you are searching
When you submit a search request, the indices that match the currently-selected index pattern are searched. The current index pattern is shown below the toolbar. To change which indices you are searching, click the index pattern and select a different index pattern.
For more information about index patterns, see Creating entity tables.
Refreshing the search results
As more documents are added to the indices you are searching, the search results shown in Discover and used to display visualizations get stale. You can configure a refresh interval to periodically resubmit your searches to retrieve the latest results.
To enable auto refresh:
-
Click Time Picker (
 ) in the Siren
Investigate toolbar.
 -
Click Auto refresh.
-
Choose a refresh interval from the list.

When auto refresh is enabled, the refresh interval is displayed next to the Time Picker, together with a Pause button. To temporarily switch off auto refresh, click Pause.
| If auto refresh is not enabled, you can manually refresh visualizations by clicking Refresh. |
Filtering by field
You can apply a field filter by using the methods described in the Filtering data in a dashboard topic.
In the Discover app, you can also apply a field filter from the Selected fields list.
The applied filters are shown below the Search field. Negative filters are shown in red.
To add a filter from the Selected fields list:
-
Click the name of the field you want to filter on. This displays the top five values for that field.
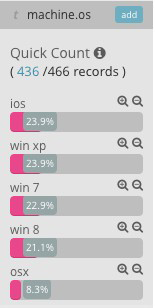
-
Click one of the following filters:
-
The Filter for value (
 ) button includes only those
documents that contain that value in the field.
 -
The Filter out value (
 ) button excludes documents that
contain that value in the field.
-
Viewing document data
When you submit a search query, the 500 most recent documents that match
the query are listed in the Documents table. You can configure the
number of documents shown in the table by setting the
discover:sampleSize property in
Advanced Settings.
By default, the table shows the localized version of the time field
configured for the selected index pattern and the document _source.
You can
add
fields to the Documents table from the Fields list. You can
sort the listed
documents by any indexed field that’s included in the table.
To view a document’s field data, click the Expand icon to the left of the document’s table entry.
![]()
To view the original JSON document (pretty-printed), click the JSON tab.
To display or hide a field’s column in the Documents table, click Toggle
column in table ( ).
).
To collapse the document details, click Collapse
( ).
).
Sorting the document list
You can sort the documents in the Documents table by the values in any indexed field. If a time field is configured for the current index pattern, the documents are sorted in reverse chronological order by default.
To change the sort order, move the mouse pointer over the name of the field you want to sort by and click the sort button. Click again to reverse the sort order.
Adding field columns to the documents table
By default, the Documents table shows the localized version of the time
field that’s configured for the selected index pattern and the document
_source. You can add fields to the table from the Fields list or
from a document’s field data.
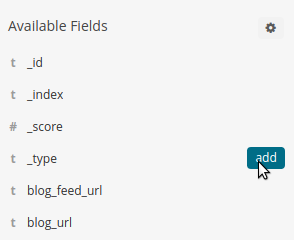
To add a field column from the Available fields list, move the mouse pointer over the field and click Add.
To add a field column from a document’s field data, expand the document
and click the field’s Toggle column in table
( ) button.
Added field columns replace the _source column in the Documents
table. The added fields are also added to the
Selected fields list.
To rearrange the field columns, move the mouse pointer over the header of the column you want to move and click the Move left or Move right button.

Viewing field data statistics
From the Fields list, you can see how many of the documents in the Documents table contain a particular field, what the top five values are, and what percentage of documents contain each value.
To view field data statistics, click the name of a field in the Fields list.

Selected fields
Selected Fields are displayed on the Selected Field list at the top left of the Discover page.
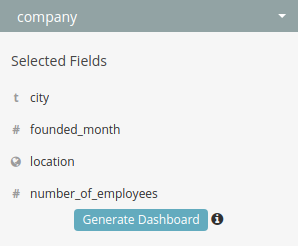
Click a field to see the field’s Viewing field data statistics.
To remove a field, click the field and click Remove.
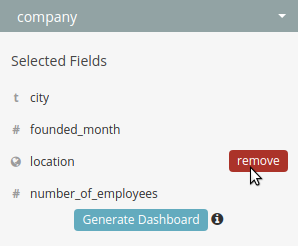
After you have selected at least one field, you can then click Generate Dashboard to begin auto generating a new Dashboard.
If you have not selected any fields, you can allow Siren Investigate to select the fields it believes are the most relevant by clicking Autoselect Most Relevant.
| This button is only visible if there are no fields selected. If you have selected fields, the Generate Dashboard button will be visible in its place. |
Auto select fields
Siren Investigate begins testing the fields with each field being analyzed for relevance against a number of heuristics, for example, whether all values are unique - which indicates a potential ID field and unlikely to be relevant for visualizations.
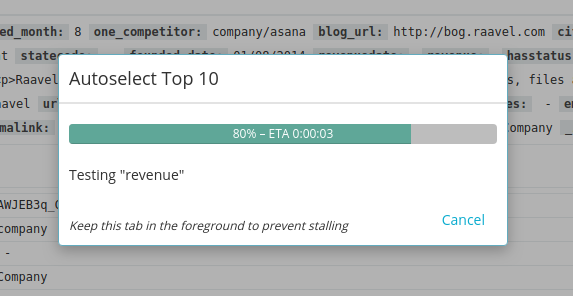
After all the fields have been analyzed, a test report is displayed.
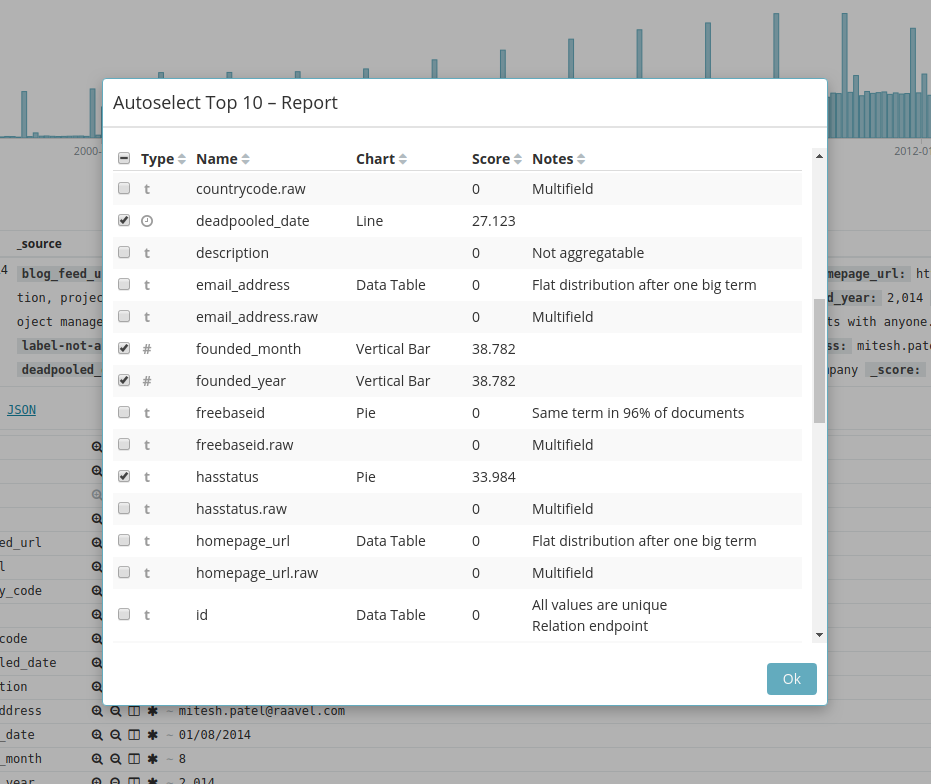
This report shows all the fields in the Discover data, which fields are selected as most relevant, the field type, the visualization selected for that type, the relevancy score and any notes on why the field was or was not selected as a relevant field.
You can add and remove fields you would like selected using the check boxes on the left.
When you are ready, click Ok to select the fields.
After the fields have populated the Selected Fields list, you are ready to generate a dashboard.
