Controlling graph expansion
In the graph, nodes display a number at the top right, which represents the number of links between that node and other nodes.
These links come from the relations that are defined in the data model. For more information, see Adding relations between entities.
For example, the node for a large multinational company, such as Google, could potentially have tens of thousands of links. The links might include connections to other companies, investors, articles that mention them, or the location of company headquarters.

|
The number, which is displayed in what is called a glyph, represents the number of links and not necessarily the number of nodes that are displayed if you expand. This is because some nodes may be connected by more than one link. |
The number of links that are displayed on a node is affected by the options that you select in the Expansion tab. So, for a node with a large number of links, such as Google, you can use this tab to limit the expansion to show only the most meaningful results.
The Expansion tab contains the following controls:
-
Force recount: Refreshes the count on nodes after you make changes.
-
Dashboard Filters: Applies the filters from a specific dashboard to the graph. This restricts the nodes that are produced by an expansion to a subset of those that are allowed by the current filters on a dashboard. For example, select the Articles dashboard to count only the number of links to articles in your dataset. And, if you have filtered the Articles dashboard, then the filter(s) will be applied to the count.
-
Relations - simple: This option limits the nodes that are produced by an expansion only to the simple relations that you specify. The list of simple relations that you see correlates to the relations that are defined in the data model.
-
Relations - aggregated: This option limits the nodes that are produced by an expansion only to the aggregated relations that you specify. Aggregated relations are links that count the intermediate entities that are in between two entities in the data model.
|
Aggregated relations are not counted in the glyph on a node. So, if you deselect all simple relations, the count on all nodes will be zero regardless of the selections you make under Relations - aggregated. |
Aggregated relations
|
It is often helpful to deselect all simple relations before you enable or disable aggregated relations. |
Aggregated relations are processed through the Elasticsearch back-end system and are, therefore, extremely well-performing. They also work well in the case of intermediate nodes that have multi-value attributes.
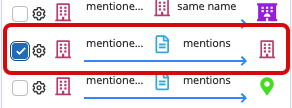
For example, articles can mention many companies. By activating the aggregated relation Company → Article → Company (companies mentioned in articles that mention companies) and selecting some of the nodes, you get a useful graph that displays which companies are mentioned alongside other companies within articles.

Configuring aggregated relations
By default, aggregated relations return the top ten links by the count of the intermediate entities. To change the number of returned links, click Configure aggregation (the cog icon beside the aggregated relation’s checkbox) and adjust the value in the Size field.
The Configure aggregation button also offers the ability to switch to significant terms as an aggregation, instead of terms. This option removes values that are less meaningful. For example, it excludes values that are too common in the dataset to be of interest, while highlighting those that are tied to the initial node that may be of interest to your investigation.
For more information, see the Elasticsearch documentation about the Significant Terms aggregation.
To make the list of aggregated relations cleaner, ensure that you configure the data model to mark when fields are a unique value and when they are a single value. For more information, see the documentation about the Fields tab.