Searching and filtering data
One of the most effective ways to begin an analysis in Siren Investigate is to filter the data down to include what is most important and to exclude the less useful information.
You can either use the Search fields to apply mostly text-based queries, or you can use the Filter functions to apply queries to specific fields in the records.
Searching data
|
This section refers to the Search field at the top of a dashboard (1), which searches the data in that dashboard only. To learn more about the Global Search field at the top of the Dashboard menu (2), see the
Global Search interface.
|
You can perform a search on the records in a dashboard by using one of the following methods.
Free-text search
To perform a free-text search, enter a text string. For example, enter new york.
By default, the search field uses OR logic. So, if you search for new york, the search returns the records that contain either 'new' or 'york', and any records that contain the full string 'new york' are shown at the top of the list.
To search for the entire phrase only, include it in quotation marks. For example, "new york".
|
Administrators can change the default logic to |
Searching a specific field
To search for a value in a specific field, prefix the value with the name of the field. For example, to find all of the entries that contain the value media in the title field, enter title:media.
Searching for a range of values
To search for a range of values, you can use the bracketed range syntax, [start_value TO end_value]. For example, to find articles that have a publication year between 2011-2013, enter pyear:[2011 TO 2013].
Wildcard and fuzzy search
To perform a single character wildcard search, use the question mark symbol. For example, to search for "text" or "test", enter the term te?t.
To perform a multiple-character wildcard search, use the asterisk symbol. For example, to search for test, tests or tester, enter the term, test*.
To perform a fuzzy search, use the tilde symbol at the end of a single-word term. For example, to search for a term that is similar in spelling to "message" use the fuzzy search message~. This search will find terms like iMessage, and messaging.
Advanced search using Boolean operators
To specify more complex search criteria, you can use the Boolean operators AND, OR, and NOT.
For example, to find articles that have a publication year between 2011-2013 and contain the words "social" or "media" in their title, enter pyear:[2011 TO 2013] AND (title:social OR title:media).
Regular expressions are also supported. For more information, see Regular expression syntax.
|
These examples use the Lucene query syntax. You can also submit queries by using the Elasticsearch Query String Query. |
Filtering data
You can filter the data by the contents of one or more fields in the records. You can create filters in the following ways:
-
From a visualization
-
From the record view
-
From the time filter button
After you create a filter, the filter conditions display in an interactive filter button below the Search field.

If you want to hide the filter conditions and display a text instead, edit the filter and enter a label.

You can filter data to display only the records that contain a particular value in a field. You can also create negative filters that exclude records that contain the specified field value.
Adding a filter from a visualization
You can add filters by interacting directly with visualizations.
For example, if your dashboard contains a pie chart, you can click a segment. This applies a filter based on the value that you select.
|
You can combine filters by creating an
|
Advanced: How visualizations and filters interact with entity tables
Most visualizations in Siren Investigate are connected to an entity table. The following screenshot shows two visualizations (a heatmap and an analytic table), which are both connected to the company entity table.
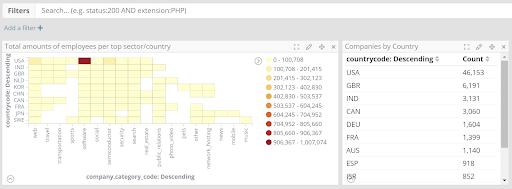
When a visualization is based on an entity table, it reacts to filters or textual queries that are made in the dashboard.
For example, in the following screenshot, the same visualizations update when a filter is added (in this case, countrycode=USA).
Filters can be created either by clicking on the visualizations themselves, or manually.
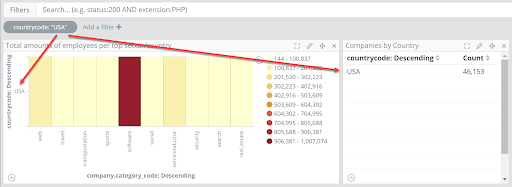
There is a limitation with this simple filtering model, however. All of the visualizations try to apply the filters to their underlying entity tables, whether or not the filter is applicable.
For example, the countrycode=USA filter is applied to all of the visualizations in the dashboard, even to one that is based on the Investment entity table, which does not have a countrycode field. This will cause a message to display on that visualization, saying 'No results found'.
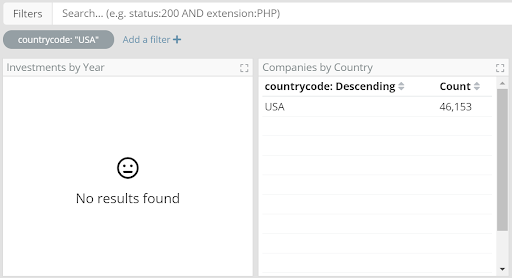
For this reason, it is recommended that dashboards generally contain visualizations that are based on the same entity table (or entity tables that have identical/compatible field names), so that filters work coherently across all visualizations.
|
The Dashboard 360 feature overcomes this limitation by allowing relationally-connected visualizations. For more information, see Creating 360 dashboards. |
Adding filters by record in a Record Table
If there is a record table visualization in your dashboard, hover your cursor over a record to display the Filter for value and Filter out value buttons (the positive and negative magnifying glass icons).
For example, in a dashboard that contains a table of Companies by Country, you can filter by the country code IRL for Ireland by clicking Filter for value. Or, to exclude Irish companies from your analysis, click Filter out value.
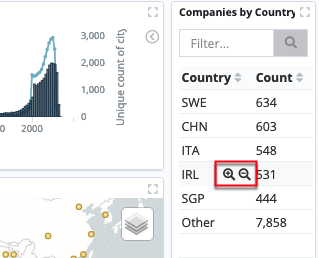
Another way to filter by records is by selecting the checkbox in the top-left corner of the table.

This displays check boxes along each row of the table. Select one or more rows (records) and click Create filter.
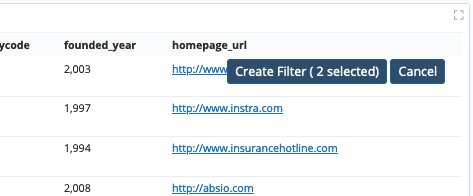
A new filter appears at the top of the dashboard, which is based on the entities that you selected.

For more information, see the Record table visualization.
Adding a filter from the Graph Browser
When you are analyzing data in the Graph Browser, you can apply a filter from the available nodes.
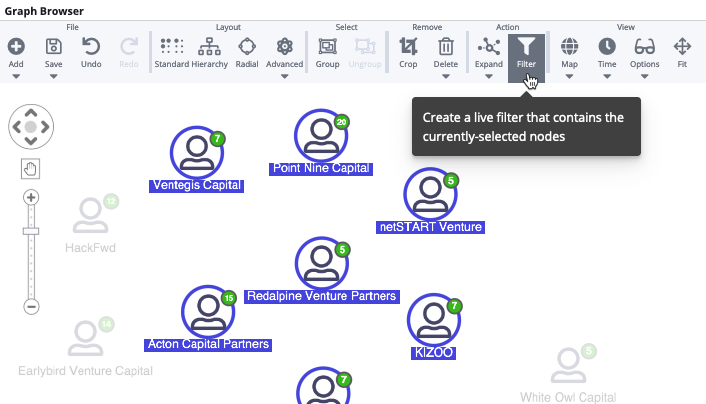
This can be useful if you find some interesting nodes that you want to investigate further in a dashboard.
-
In the Graph Browser, select the nodes that are of interest and click Filter.
-
Hover over the interactive filter button above the graph and click the pin icon
 . This updates all dashboards by filtering them to the nodes you selected.
 -
Navigate to the filtered dashboards to look more closely at the data.
For more information, see the Graph Browser.
Adding a filter from the record view
-
If your dashboard contains a Record Table visualization, you can access a range of filters by clicking the View full record button to the left of the record’s row.
![]()
In the record view, you can select one of the following filters:

-
Filter for value: Includes only those records that contain that value in the field.
-
Filter out value: Excludes records that contain that value in the field.
-
Toggle column in table: Allows you to hide or show a field as a column in the table.
-
Filter for field present: Includes only those records that contain the field.
You can filter by a single record by clicking Filter to dashboard.
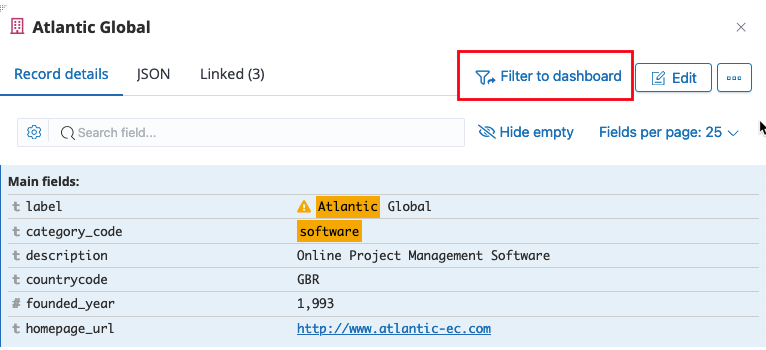
This allows you to select a dashboard in which you want to filter by the selected record.
|
A Filter to dashboard button is also available in the search results of the Global Search interface. |
Filter dashboard to dashboard
You have the option to apply the filters from one dashboard to another dashboard within the same entity table.
The button to do this appears to the right of your dashboard name and count.
Upon clicking this button, you are presented with a modal where you can select the target dashboard you wish to apply your filters to.
You have the option to reset the target dashboard to its saved state before filters from current dashboard are applied.
Adding a filter manually
-
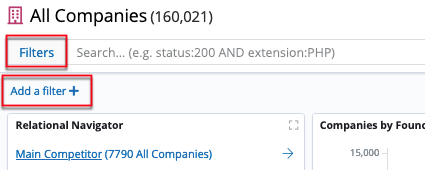
In a dashboard, click Filters and Add a filter.
-
In the Add filter dialog box, select a field to filter by.
-
Select an operator from the dropdown menu. The following operators can be selected:
isFilter where the value for the field matches the given value.
is notFilter where the value for the field does not match the given value.
is one ofFilter where the value for the field matches one of the specified values.
is not one ofFilter where the value for the field does not match any of the specified values.
is betweenFilter where the value for the field is in the given range.
is not betweenFilter where the value for the field is not in the given range.
existsFilter where any value is present for the field.
does not existFilter where no value is present for the field.
-
Specify the value(s) for the filter.
-
(Optional) Specify a label for the filter. If you do not specify a label, the filter definition is displayed on the filter.
-
Click Save. The filter is applied to the data and it appears below the Search field.
|
Advanced: You can make the filter editor more user-friendly by enabling the |
Setting a time filter
The time filter restricts any search results to a specific time period.
Before you begin
To set a time filter, an entity table must contain time-based events in its records.
You must select the field that the time filter is based on on the Info tab of the Data model app.
For example, in a dashboard about articles, you could set the time filter field as pdate, which contains the publication date of the article records.
Procedure
-
From the Options menu, click the Time filter.

-
Select one of the following tabs:
-
Quick: You can choose from one of the available quick filters, ranging from 'today' to the 'last 5 years'.
-
Relative: Specify a time range that is relative to the current time. Relative times can be in the past or in the future.
-
Absolute: Specify both the start and end times for the time filter.
-
-
(Optional) Select the dashboards you want the filter to apply to. It is applied to the current dashboard by default.
You can view more quick options by hovering your cursor over the Time filter button.
Use the arrows to move forward or backward in time. Or else, use the magnifying glass icons to zoom in to half the time range or zoom out to triple the time range.
|
If you do not save the dashboard with the new time filter applied, it will return to its last saved state when you open a new session. |
Auto-refreshing the search results
You can configure an auto-refresh interval to automatically refresh the page with the latest index data. This function periodically resubmits the search query.
When an auto-refresh interval is set, it is displayed to the left of the Time Filter in the Options menu. A pause or play button is also displayed, which allows you to pause the refresh and restart it as needed.
To set a refresh interval:
-
Click the Time Filter.
-
Click the Auto-refresh tab.
-
Select an interval from the list.

Editing filters
To edit a filter, hover your cursor over it and click one of the action buttons.

 Enable Filter
-
Disable or enable the filter without removing it. Diagonal stripes indicate that a filter is disabled.
 Pin Filter
-
Pin the filter. Pinned filters persist when you switch contexts in Siren Investigate. For example, you can pin a filter in the Discover app and it remains in place when you switch to the Visualize app.
A filter is based on a particular index field. If the indices that are being searched do not contain the field in a pinned filter, it has no effect.
 Invert Filter
-
Switch from a positive filter to a negative filter and vice-versa.
 Remove Filter
-
Remove the filter.
 Edit Filter
-
Edit the filter definition. Allows you to manually update the filter and specify a label for it.
|
To apply any of the filter actions to all of the applied filters at once, click Actions to display the menu. |
Editing a filter query
You can edit a filter by changing the field, operator, or value associated with the filter.
Or, you can directly modify the filter query that is performed to filter your search results. This allows you to create more complex filters that are based on multiple fields.
For more information, see Examples of the Elasticsearch Query DSL.


