Topic Clustering
The Topic Clustering visualization performs significance and clustering analysis on a field’s values. While similar to the Tag Cloud visualization, Topic Clustering highlights significant terms (topics) whose frequency in documents increases when current filters and search queries are applied.
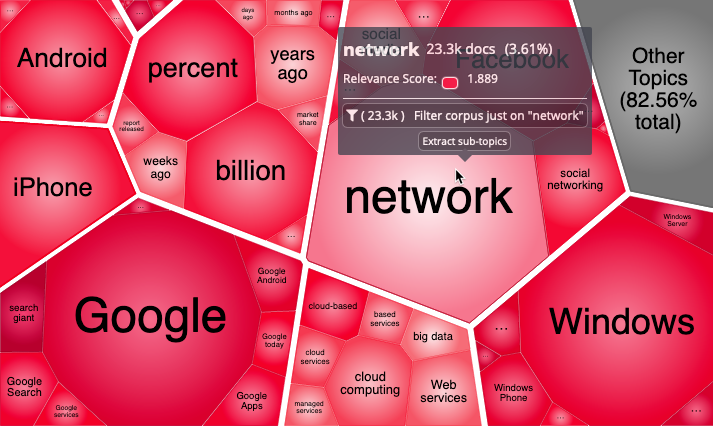
The Topic Clustering panel is divided into separate cells, each representing a term. Cell size represents the number of documents it matches, while its color represents its relevance to current queries/filters.
The visualization can also cluster together mutually significant terms, forming groups that denote 'areas of interest' of the text corpus (large set of structured texts).
Interaction
You can interact with Topic Clustering using mouse or touch:
-
Pan the view by click-and-drag/tap-and-drag
-
Zoom in or out using the mouse wheel/pinch-zoom gestures
-
Zoom out to initial view and close all cells with the ESC key
-
Open a cell with a double-click/tap
-
Close a cell by double-clicking its header
Expanding and collapsing cells
Double-click/tap a cell to open it; this loads its significant sub-terms and displays them recursively. It also puts the cell term in a white header at the top of the cell.
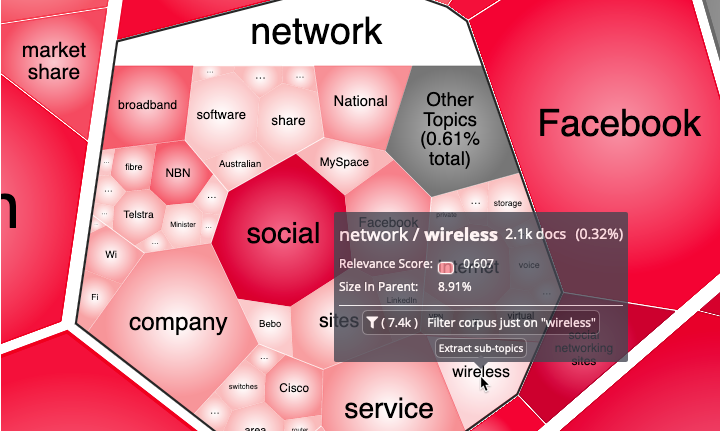
Once loaded, cells are automatically opened and closed depending on your current level of zoom. However, you can still open a cell explicitly by double-clicking on it. Conversely, you can close it by double-clicking on the white cell header.
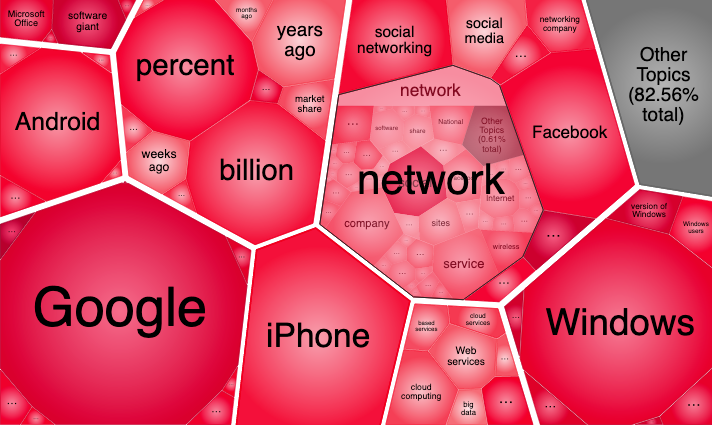
Loaded cells open/close automatically as you zoom in/out.
Tooltip
Hovering over a cell displays details such as the number of documents it represents and its relevance/significance score:
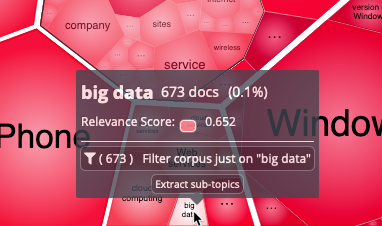
You can click on Filter corpus just on "<topic>" to apply the topic as a new global filter. Clicking on Extract sub-topics calculates sub-topics relevant to the highlighted topic; it is equivalent to double-clicking on the cell.
Live Filter
Clicking a cell selects it. In a dashboard, this automatically applies a live filter matching the cell’s term to other visualizations in that dashboard.
The live filter does not apply to the visualization itself, or other Topic Clusterings in the same dashboard, which retain their UI state.
For example, you can pair a Topic Clustering with a Record Table next to it. Selecting a cell updates the table and displays associated document samples.
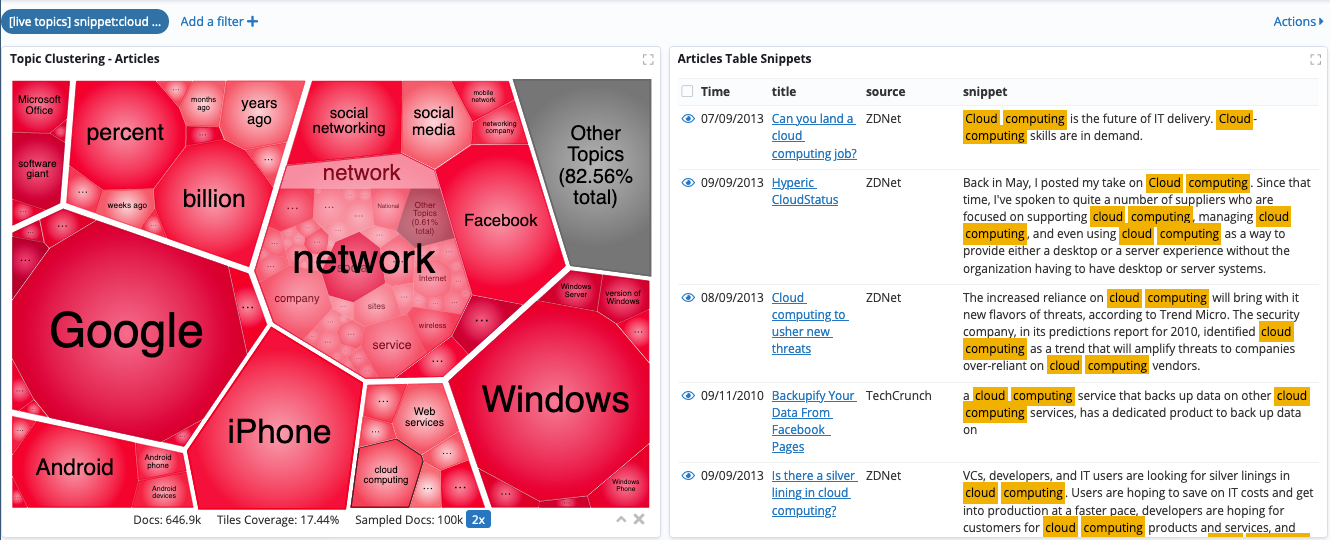
Setting up the visualization
The Data tab
The only required input is the field to operate on, which must be set before the visualization can render. You can select any string field, but the visualization works best on multi-valued fields like analyzed text fields or fields with array values, such as lists of tags.
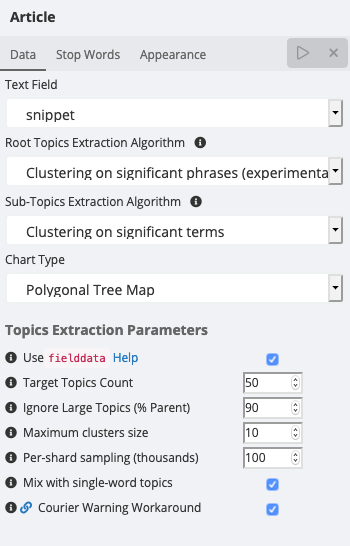
Terms extraction can work in Plain mode or Clustering mode:
-
In Plain mode, no clustering is performed, and only a flat selection of the most significant terms is displayed.
-
In Clustering mode, significant topics are put in clusters based on their mutual significance. This mode can trade off some high-significance plain terms in favor of filling up the clusters. This mode is only available for multi-valued fields.
You can select a different extraction mode when retrieving terms at the initial (root topics) level, and when expanding cells (sub-topics) with a double-click/tap.
Changing the Chart Type option to Square renders the visualization as a more traditional square treemap:
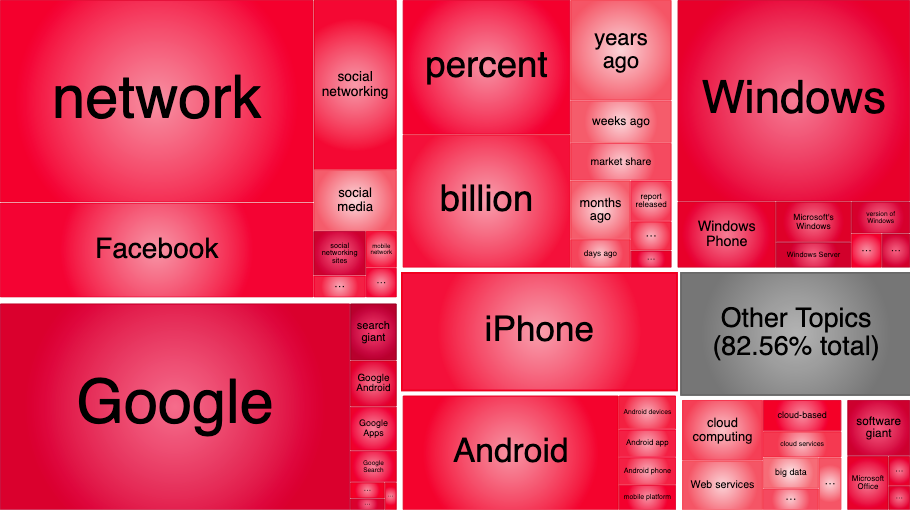
The following parameters control terms generation:
-
Target Topics Count: The desired number of terms to calculate and display.
-
Ignore Large Topics: Specifies how relatively large terms (as percentage) will be ignored, as they can be considered trivial.
-
Maximum Clusters Size: The maximum number of terms a cluster can have.
-
Per-shard documents (thousands): Restricts document analysis to the specified number of documents, per shard, chosen among the best matching for current search query and filters. Can be used to discard analysis of the worst-matching documents to gain a speed boost.
Additionally, the following parameters are available on analyzed text fields:
-
Use
fielddata: Useful for testing the visualization’s performance with or without using the advancedfielddataElasticsearch setting. For more details, refer to the inline explanation, which is available by clicking the Help button. -
Text-to-terms sampling (thousands): When Use
fielddatais disabled, it limits term generation to the specified amount of sample documents per shard. The sampled documents are the best matches for the current search query and filters. -
Courier Warning Workaround: Applies a workaround for a known issue with Elasticsearch up to version 7.9.0, at a small processing cost.
The Stop-Words tab
Text field values often contain undesirable or irrelevant terms that should be filtered out; these are called stop-words.
Stop-words are best applied at index-time using the appropriate Elasticsearch analyzers support. Check the Elasticsearch stop-words documentation for further details. However, some undesirable words will inevitably slip past the indexing phase. Some words may also be undesirable only in the context of a particular visualization.
You can provide an additional list of stop-words to be filtered by the visualization itself. The list is configured as separate lines in the Stop Words tab; each line is a separate stop-word.
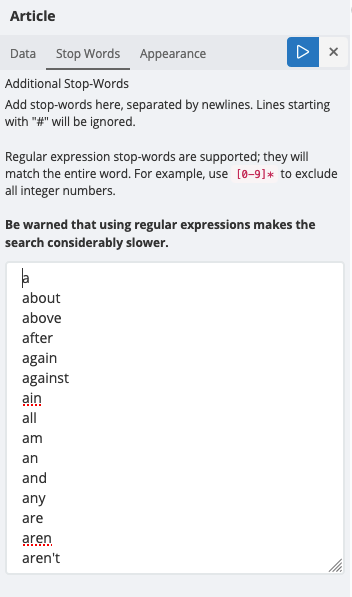
Regular expressions as stop-words are supported, which can be useful to, say, remove all numbers. However, using regular expression stop-words incurs a performance penalty. A single regular expression is sufficient, as it will force all stop-words to be included in a regular expression separated by | (pipe) conditionals.
The Appearance tab
Cell colors are associated with the relevance/significance score calculated for each term, while cell size relates to the number of documents it matches.
You can change the colors displayed by adjusting two colors representing the extremes of the color palette.
| It is good practice to set the Low Relevance color to a low saturation (paler) value of the selected color, and set the High Relevance color to a high saturation (more intense) value of the same color. |
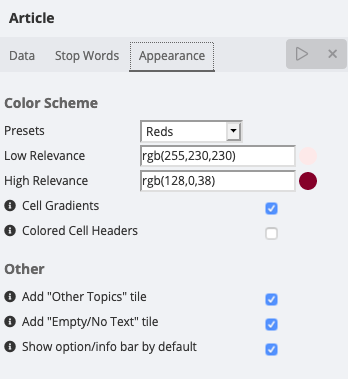
You can also fine-tune some of the aspects of the rendered chart using the following options.
-
Cell Gradients: controls the rendering mode of cell backgrounds. When enabled, cells will be rendered with a nice-looking smooth-colored gradient. You can disable this option to render cells using a flat color, which is faster and arguably less distracting.
-
Colored Cell Headers: controls coloring of cell headers. When enabled, opened cell headers will be rendered with a smooth gradient based on the opened cell’s relevance score. When disabled, the header will be rendered with a flat white color, to separate it from child cells.
Other settings that affect the visualization are:
-
Add "Other Topics" tile: Adds a gray cell representing the documents not covered by the generated topics.
-
Add "Empty/No Text" tile: Adds a white cell representing documents that are missing the input field, or whose value is an empty string (the latter only for
keywordfields due to a technical limitation). -
Show option/info bar by default: Whether the bottom bar with information about the rendered topics is opened or closed when the visualization renders the first time.
Remarks
No JDBC support
The Topic Clustering visualization makes use of the significant_terms and
significant_text Elasticsearch aggregations to calculate the most
significant terms of the input field under current filters and query terms.
As JDBC drivers do not offer these capabilities, JDBC back-end systems are not supported by this visualization.
fielddata support
Topic Clustering supports the fielddata setting for full-text fields, which trades off memory usage
for execution speed.
Enabling fielddata can result in high memory usage on the Elasticsearch
cluster, so you should refer to the
official
Elasticsearch guide for more information on various
techniques that can be applied to limit and monitor the memory footprint
related to fielddata.
If the memory footprint is still too high, you may consider deactivating
fielddata and tuning the Text to terms sampling (thousands) parameter to
keep execution times acceptable. This can result in the reduced precision of the
generated terms.
The Relevance Score function
The relevance score function, which is applied by the Topic Clustering visualization, is
the same function that is applied by default in the
Elasticsearch significant_terms aggregation.
A topic’s relevance/significance score represents the topic increase in frequency with respect to its parent topic. For top-level topics, the parent topic implicitly matches the current search query and filters.
However, when no search query or filter is applied it is not possible to establish a foreground/background set pair, so there is nothing to define significance against.
In these cases, the visualization adopts alternative relevance score functions:
-
In Plain terms mode, each term is scored according to its matching documents count normalized by the total documents count. This is like selecting the largest terms in the field.
-
In Clustered terms mode, each term is scored according to an average of its own significant sub-terms (the significant terms found when it is used as a filter).