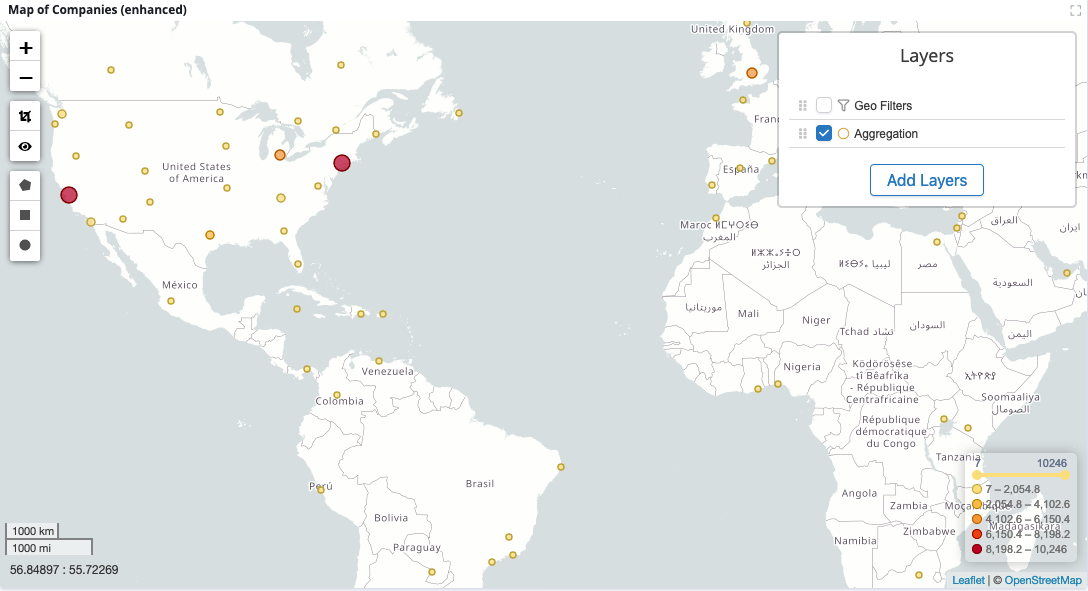
Enhanced Coordinate Map
The Enhanced Coordinate Map visualization displays a geographic area that is overlaid with circles. The circles are keyed to the data that is determined by the buckets that you specify.
You can use this visualization to view spatial information from one or more indices as layers on the map. Data is filtered the same way as other visualizations on the dashboard.
You can enhance this data by providing context with base layers (WMS/XYZ tile layers) and stored layers from multiple sources. For example, you can configure roads, satellite tile layers, or a hybrid from sources such as Google, Bing, or OpenStreetMap.
Enhanced Coordinate Maps are highly customizable, with options for different icons, sizes, colors, or minimum and maximum zoom levels on vector layers.
