Dev tools
The Dev Tools page contains development tools that you can use to interact with your data in Siren Investigate.
Console
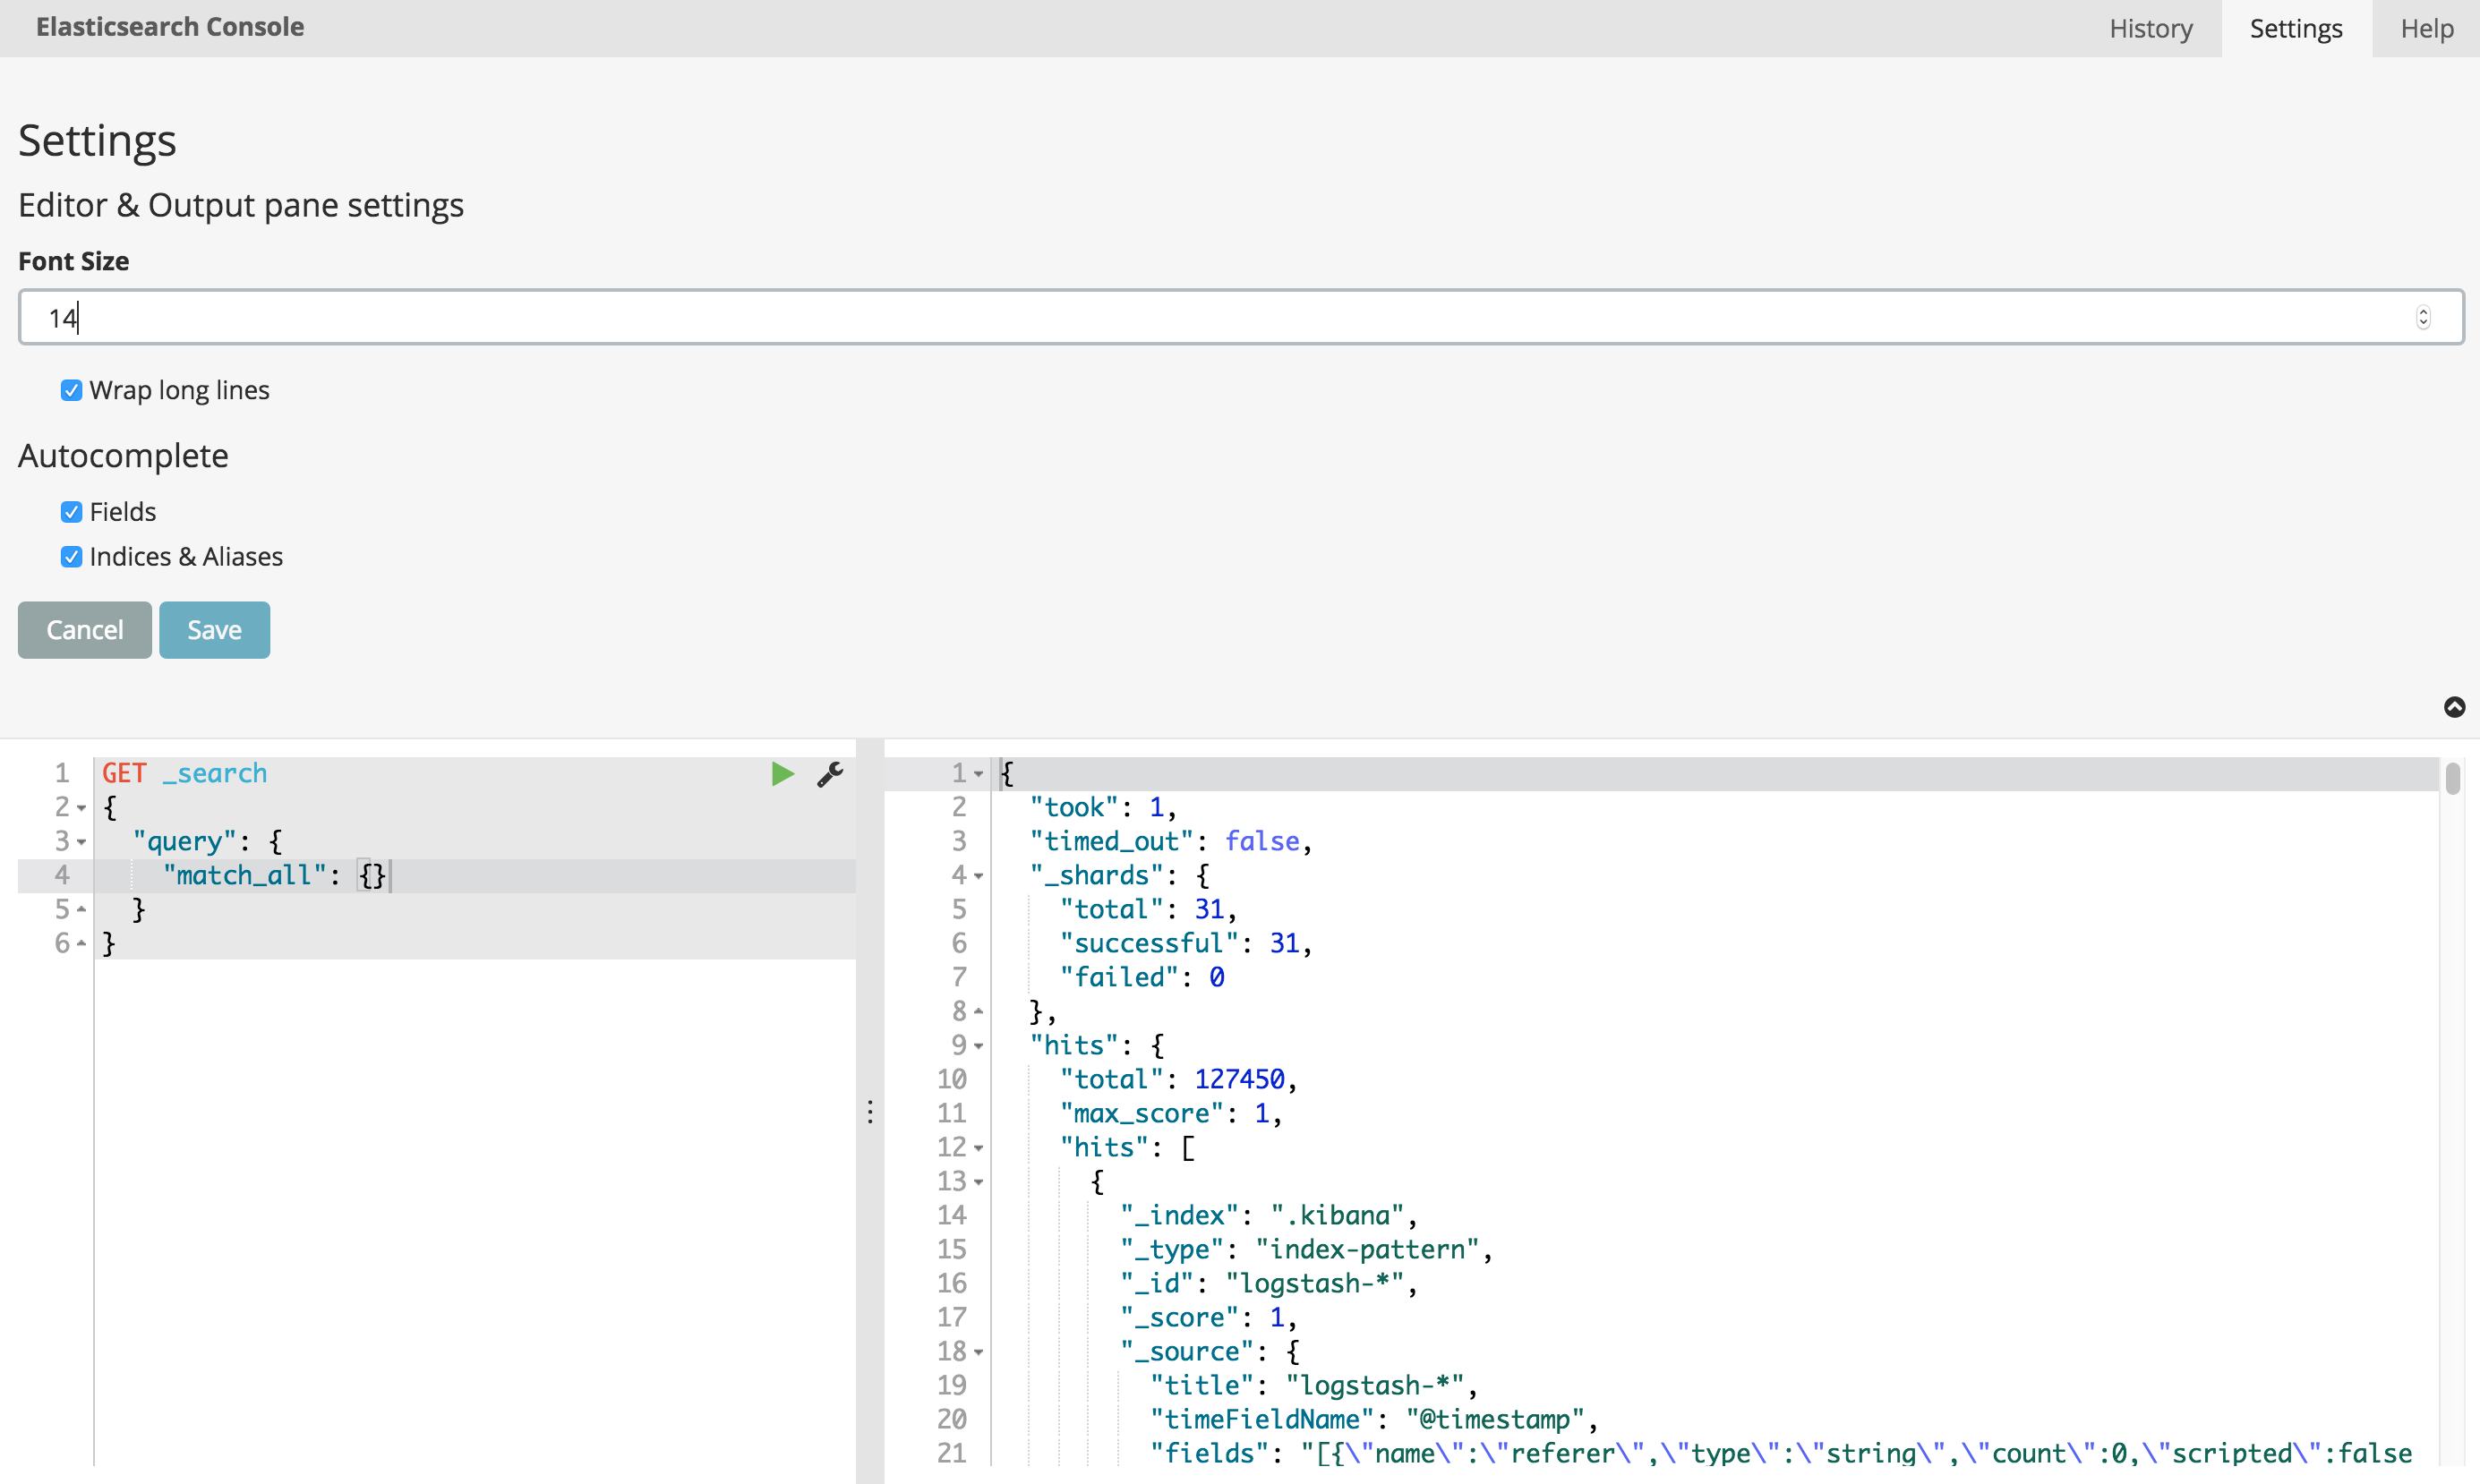
The Console plugin provides a UI to interact with the REST API of Elasticsearch. Console has two main areas: the editor, where you compose requests to Elasticsearch, and the response pane, which displays the responses to the request.
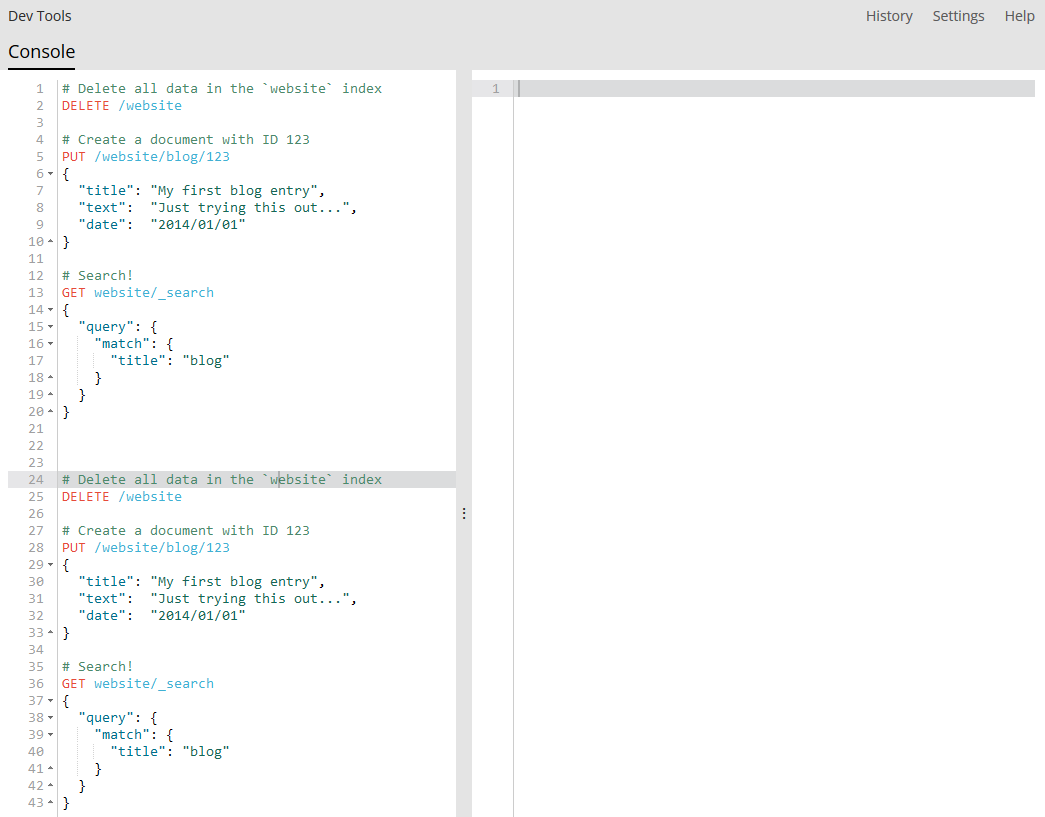
Console understands commands in a cURL-like syntax. For example the following Console command
GET /_search
{
  "query": {
    "match_all": {}
  }
}
is a simple GET request to Elasticsearch’s _search API. Here is
the equivalent command in cURL.
curl -XGET "http://localhost:9200/_search" -H "Content-Type: application/json"-H "Content-Type: application/json" -d'
{
  "query": {
    "match_all": {}
  }
}'
In fact, you can paste the command into Console and it will automatically be converted into the Console syntax.
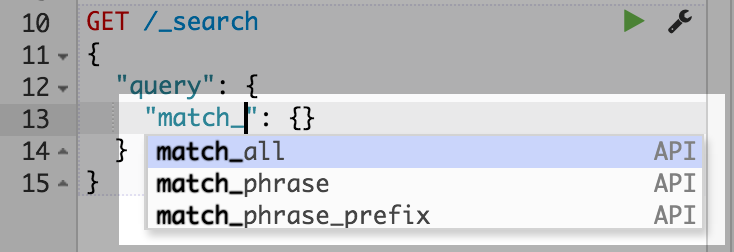
When typing a command, Console will make context sensitive suggestions. These suggestions can help you explore parameters for each API, or to just speed up typing. Console will suggest APIs, indexes and field names.
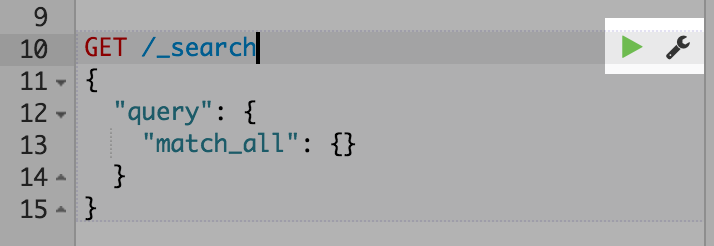
After you have typed a command in to the left pane, you can submit it to Elasticsearch by clicking the little green triangle that appears next to the URL line of the request. Notice that as you move the cursor around, the little triangle and wrench icons follow you around. We call this the Action Menu. You can also select multiple requests and submit them all at once.
When the response come back, you should see it in the left panel:
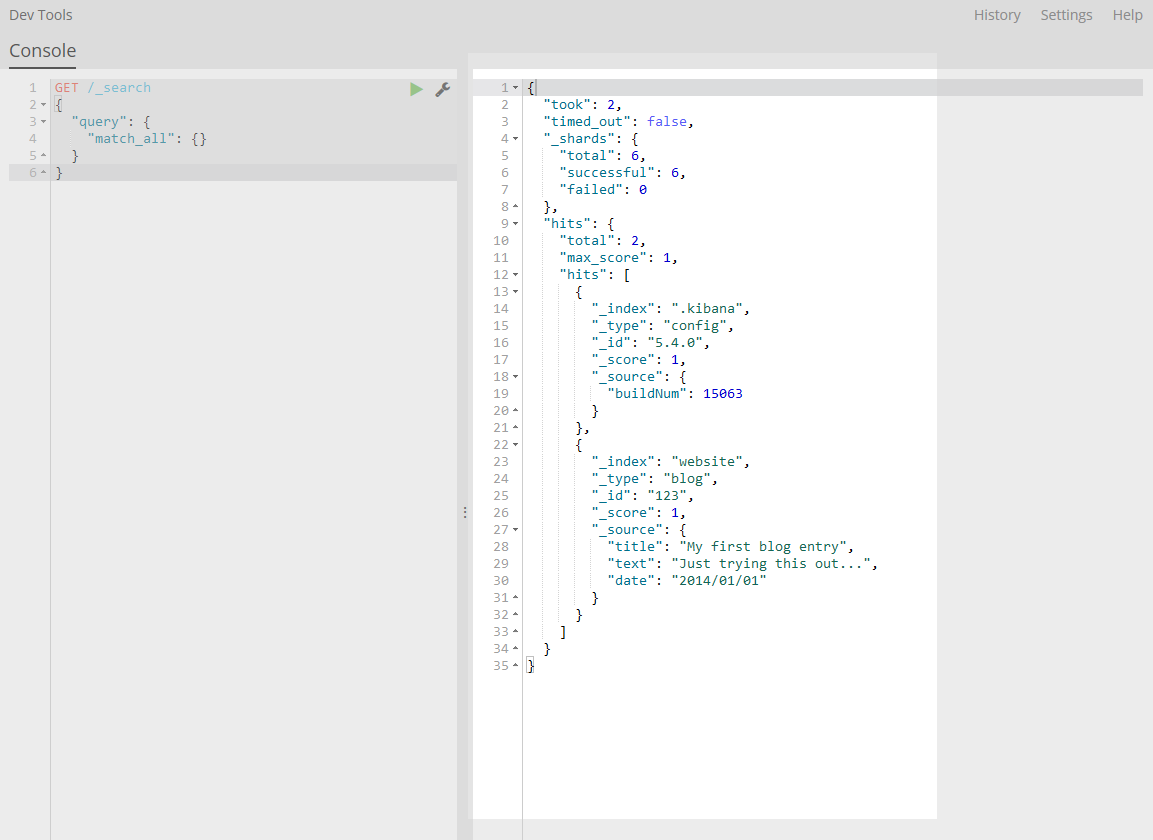
The console user interface
In this section you will find a more detailed description of the UI of the Console. The basic aspects of the UI are explained in the Console section.
Multiple requests support
The Console editor enables writing multiple requests below each other. As shown in the Console section, you can submit a request to Elasticsearch by positioning the cursor and using the Action Menu. Similarly you can select multiple requests in one go:
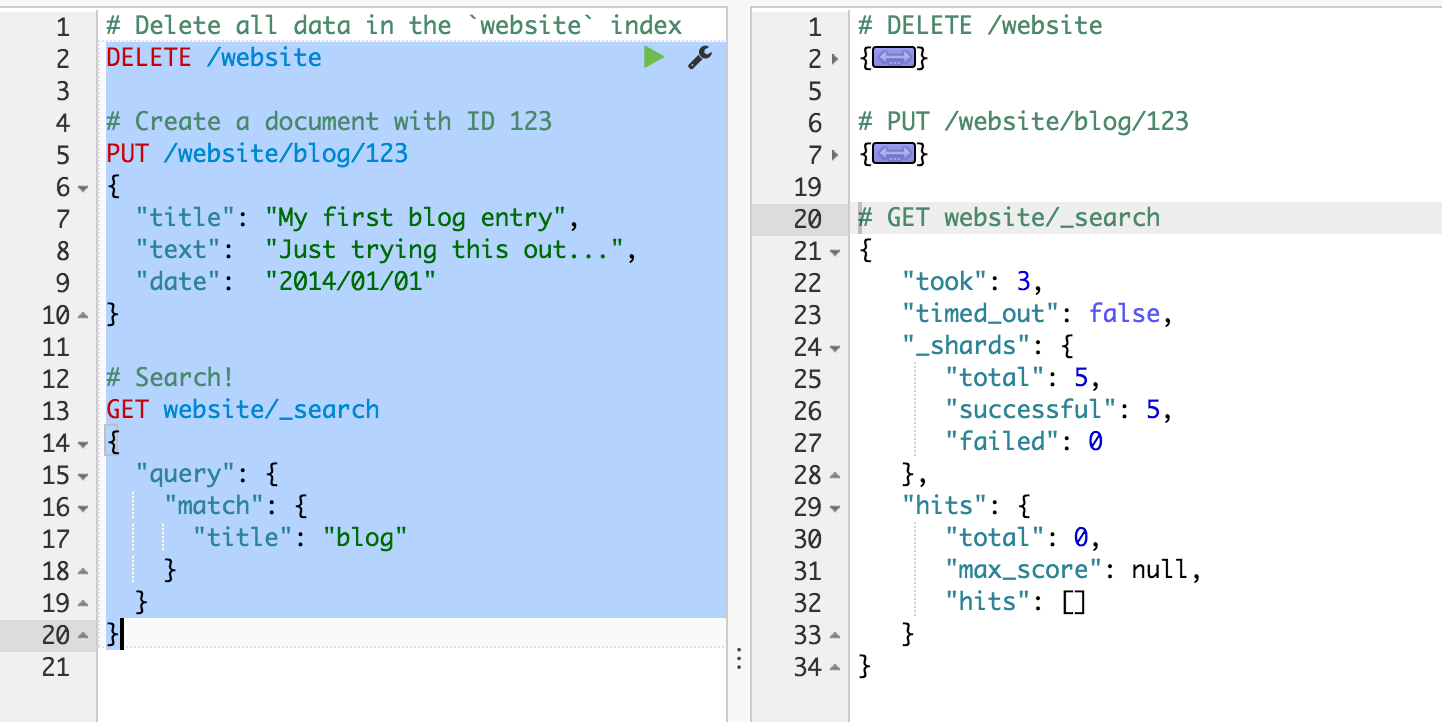
Console will send the request one by one to Elasticsearch and show the output on the right pane as Elasticsearch responds. This is very handy when debugging an issue or trying query combinations in multiple scenarios.
Selecting multiple requests also enables you to auto format and copy them as cURL in one go.
Auto formatting
The console enables you to auto format messy requests. To do so, position the cursor on the request you would like to format and select Auto Indent from the action menu:

Console will adjust the JSON body of the request and it will now look like this:
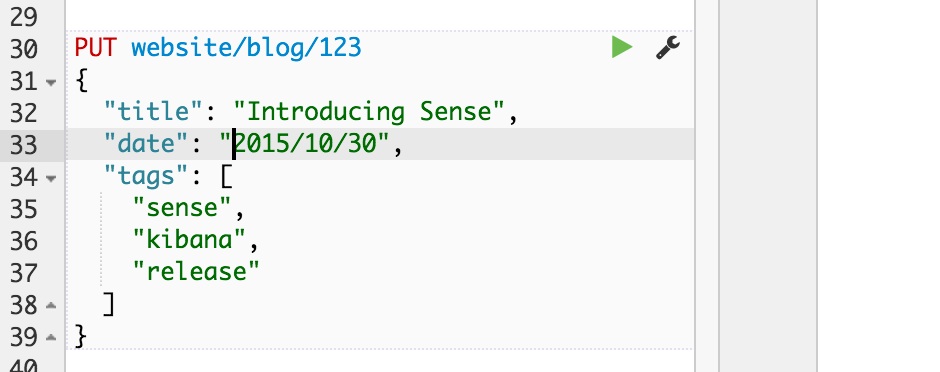
If you select Auto Indent on a request that is already perfectly formatted, Console will collapse the request body to a single line per document. This is very handy when working with Elasticsearch’s bulk APIs:

Keyboard shortcuts
The console comes with a set of keyboard shortcuts making working with it even more efficient. Here is an overview:
General editing
-
Ctrl+A: Auto indent current request.
-
Ctrl+Space: Open Auto complete (even if not typing).
-
Ctrl+Enter: Submit request.
-
Ctrl+Up: Jump to the previous request start.
-
Ctrl+Down: Jump to the next request end.
-
Ctrl+Alt+L: Collapse/expand current scope.
-
Ctrl+Alt+0: Collapse all scopes but the current one.
-
Ctrl+Alt+Shift+0: Expand all scopes but the current one.
History
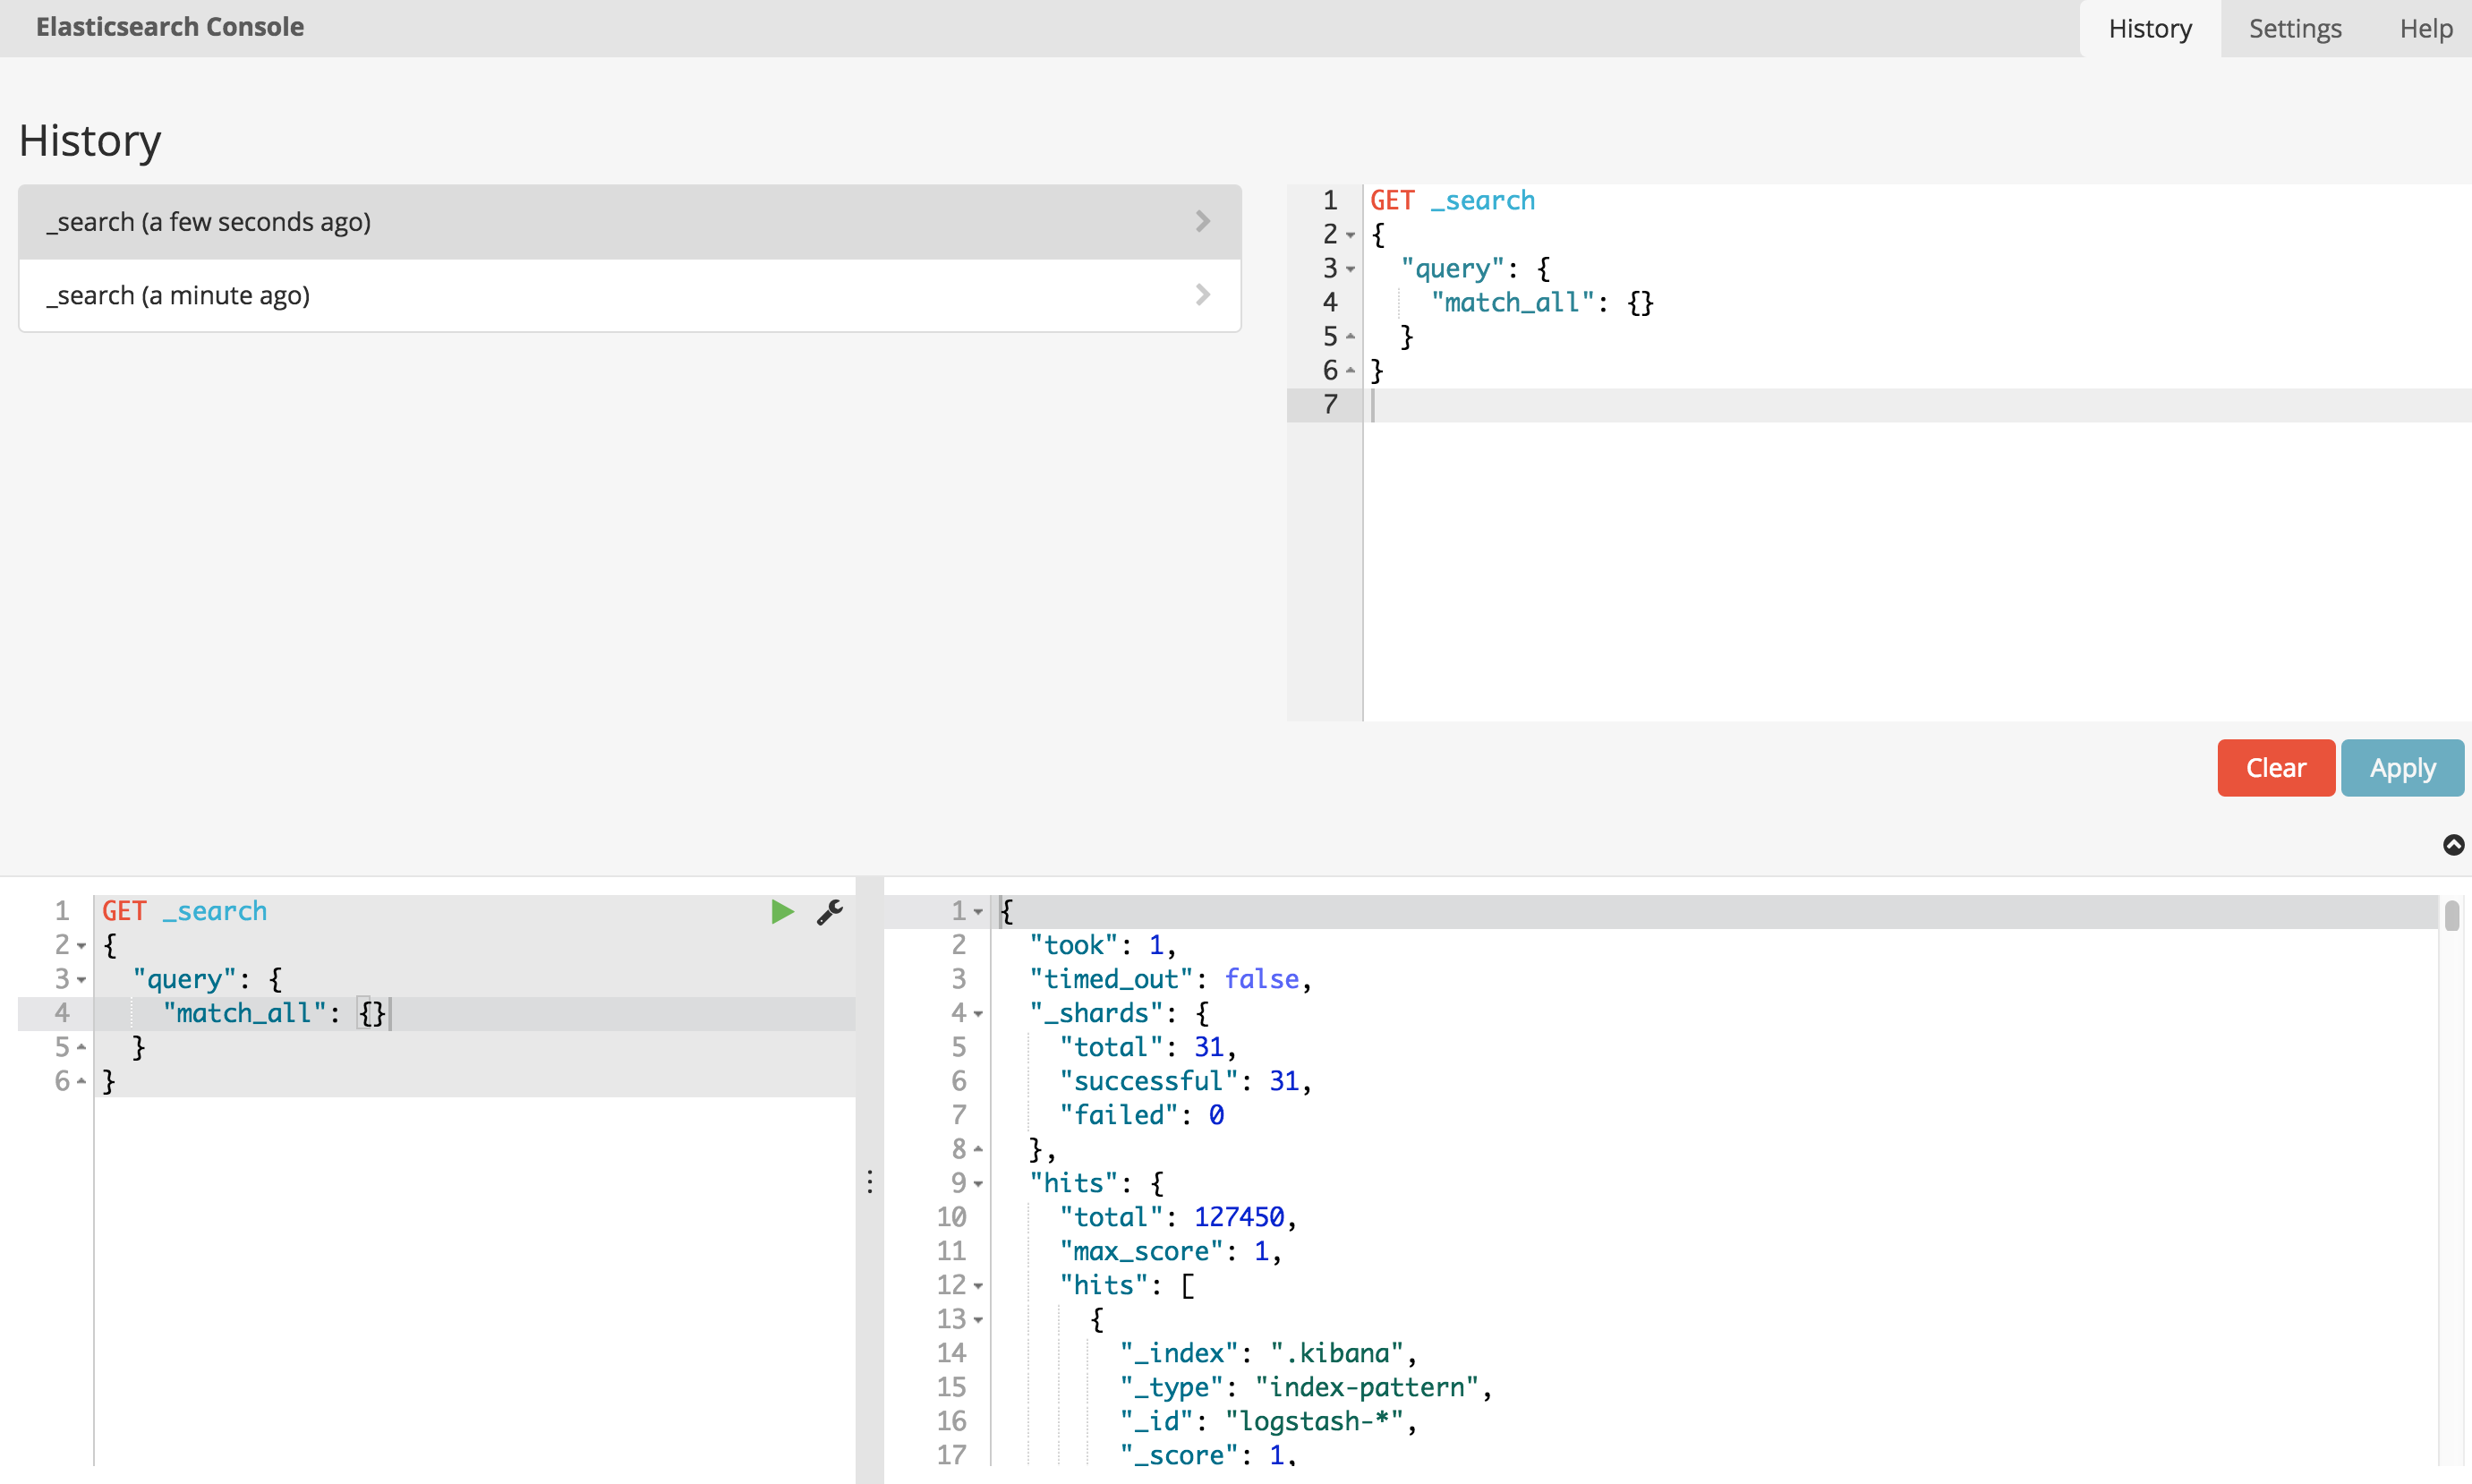
The console maintains a list of the last 500 requests that were
successfully executed by Elasticsearch. The history is available by
clicking the History icon on the top right side of the window. The
icons opens the history panel where you can see the old requests. You
can also select a request here and it will be added to the editor at the
current cursor position.
Translate join query
Siren Investigate has a tool for translating Siren Investigate specific DSL query syntax into raw Elasticsearch query syntax.
To access it, go to /app/kibana#/dev_tools/translateJoinQuery in the
URL bar.
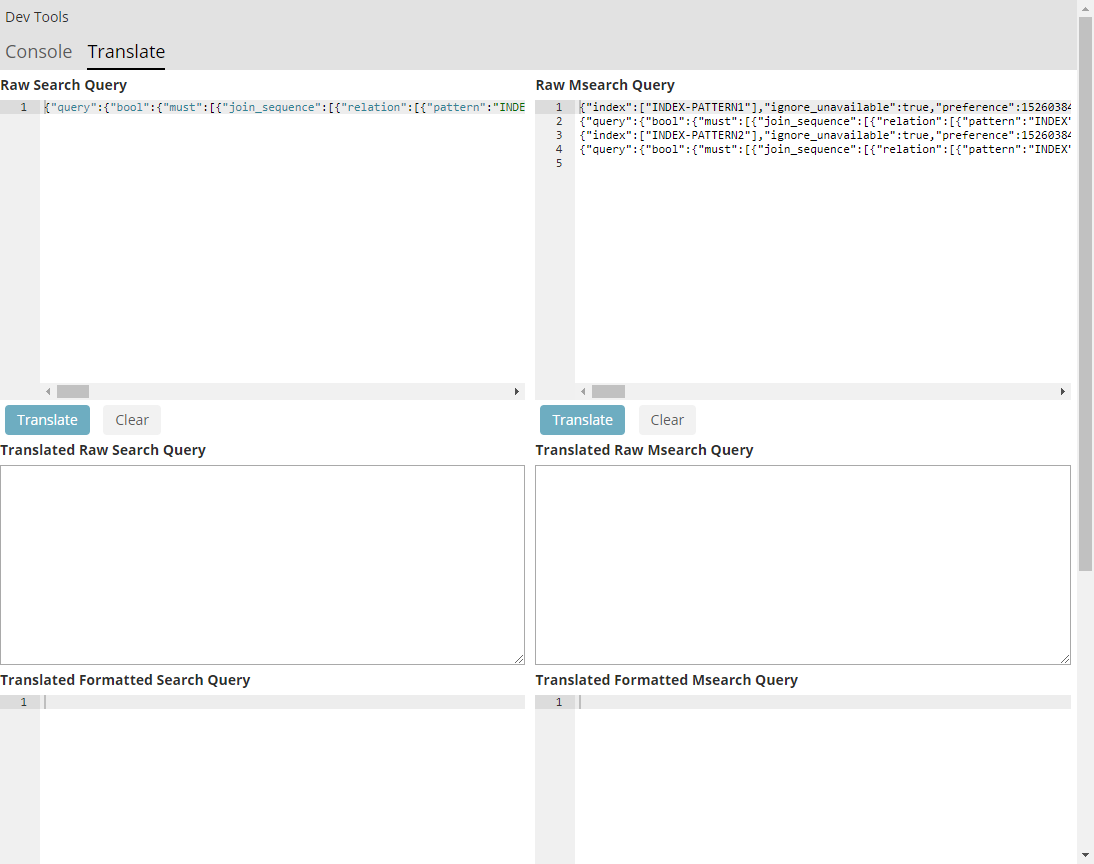
Paste your DSL query into the Raw Query box at the top.
Then click Translate to see the raw Elasticsearch query in the Translated Query box at the bottom.
