Customizing visualizations
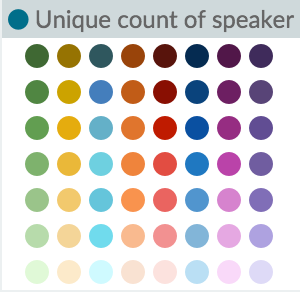
You can customize the colors of your visualization by clicking the color dot next to each label to display the color picker.

Enter a string in the Custom Label field to change the display label.
You can click the Advanced link to display more customization options for your metrics or bucket aggregation:
- Exclude Pattern
-
Specify a pattern in this field to exclude from the results.
- Include Pattern
-
Specify a pattern in this field to include in the results.
- JSON Input
-
A text field where you can add specific JSON-formatted properties to merge with the aggregation definition, as in the following example:
{"script" : "doc['grade'].value * 1.2"}| In Elasticsearch releases 1.4.3 and later, this functionality requires you to enable dynamic Groovy scripting. |
The availability of these options varies depending on the aggregation you choose.