Performing a link analysis
Link analysis is a useful way to analyze nodes that are grouped based on shared properties. For example, you could look at:
-
All records located in a particular country.
-
All IP addresses from server room A.
-
All companies that were founded in a particular year.
This can reduce graph clutter and make it easier to discover patterns and drill down into clusters during analysis.
|
Link analysis is best performed on a small selection of nodes. This helps with system performance and to keep the graph manageable as you expand the nodes. Filter dashboards as much as possible before adding them to the graph. |
How to perform a simple link analysis
-
In the Dashboard bar, expand the TOOLS group and click Graph Browser.
-
Drag the pre-filtered dashboards that you want to explore to the Graph Browser window.
-
From the toolbar, select a Layout option to rearrange the nodes into the layout that you like.
-
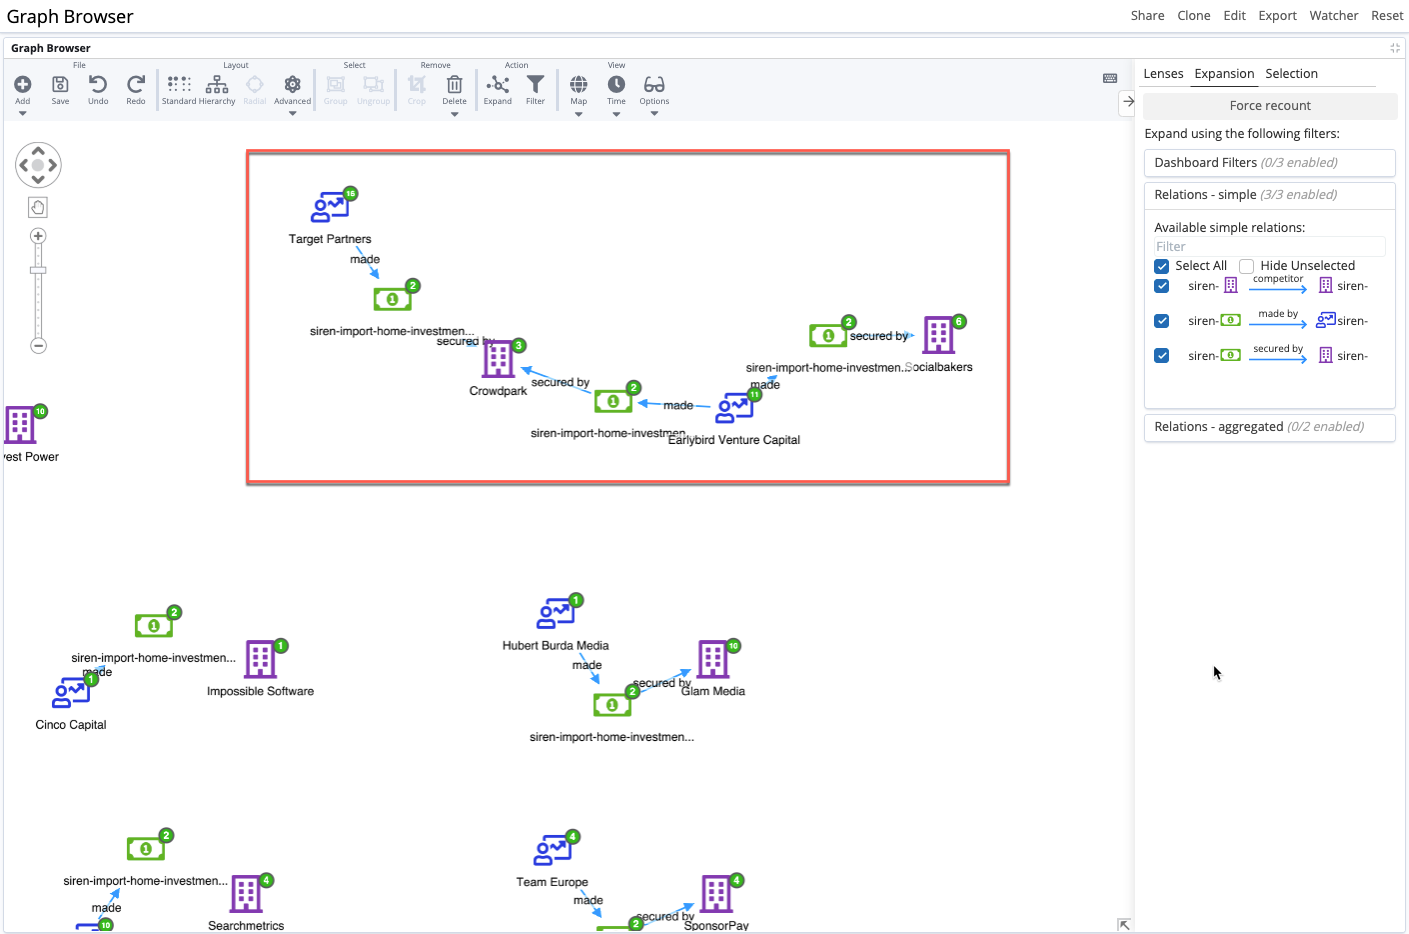
To examine a particular set of nodes, set the cursor to selection mode, drag a rectangle around the nodes and from the toolbar, click Crop. This removes everything else from the Graph Browser.
-
Before you expand the nodes, it is good practice to save this initial state. To do so, click Save and name the graph.
-
Select one or more nodes and right-click to open the contextual menu.
-
Select Expand by relation.
Your investigation might involve expanding nodes one-by-one to look at their relations. You can also examine nodes by location in the map mode or by chronology in the timeline mode.
You can use the Relations tab to include or exclude relations from your expansions. For more information, see Controlling graph expansion.
Example: A link analysis use case
An investigator wants to look closely at investments made by German investors into American companies. They suspect that some investors are investing in the same companies.
They start by filtering down their dashboards, containing large data sets of companies, investors and investments, to show only the countries relevant to their investigation.
Now, they can drag the dashboards made up of 31 American companies, 34 German investments, and 22 German investors into the Graph Browser.
The records in these dashboards are linked by relations, which are set in the Data model app. A relation, for example, is that an investor made an investment, and that the investment was secured by a company.
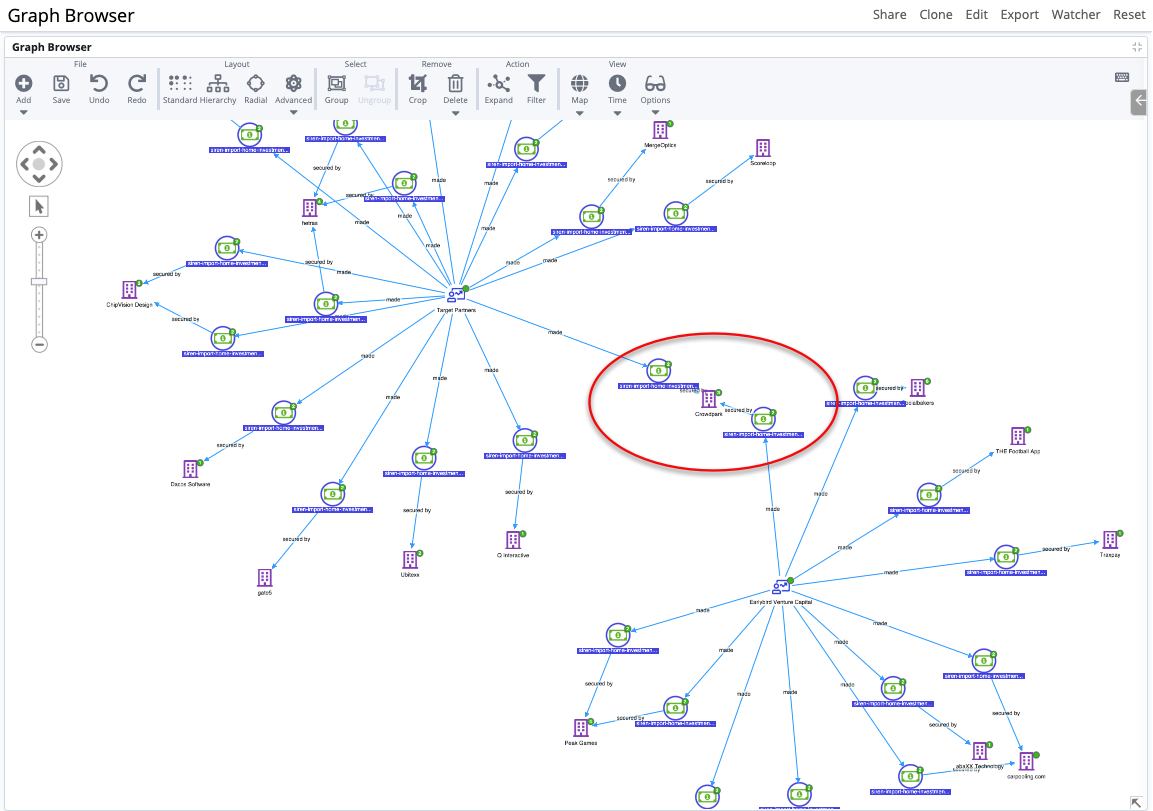
The investigator notices a collection of nodes in the graph that might tell an interesting story.
They select the nodes, crop the graph down to focus on just these nodes, and save the graph.

They select the two investor nodes in this group and right-click Expand by relation. This shows them all of the investments made by these two investors.
If they then select an investment node and right-click Select - by entity type, all investment nodes are selected at once.
By clicking Expand by relation one more time, the entities that are related to the investments are shown. The investigator can now see clearly that only one investment each was made to a common company by these two investors.

The investigator decides to go one step further, to answer the question: Did the two German investors fund this company "CrowdPark" in the same time period?
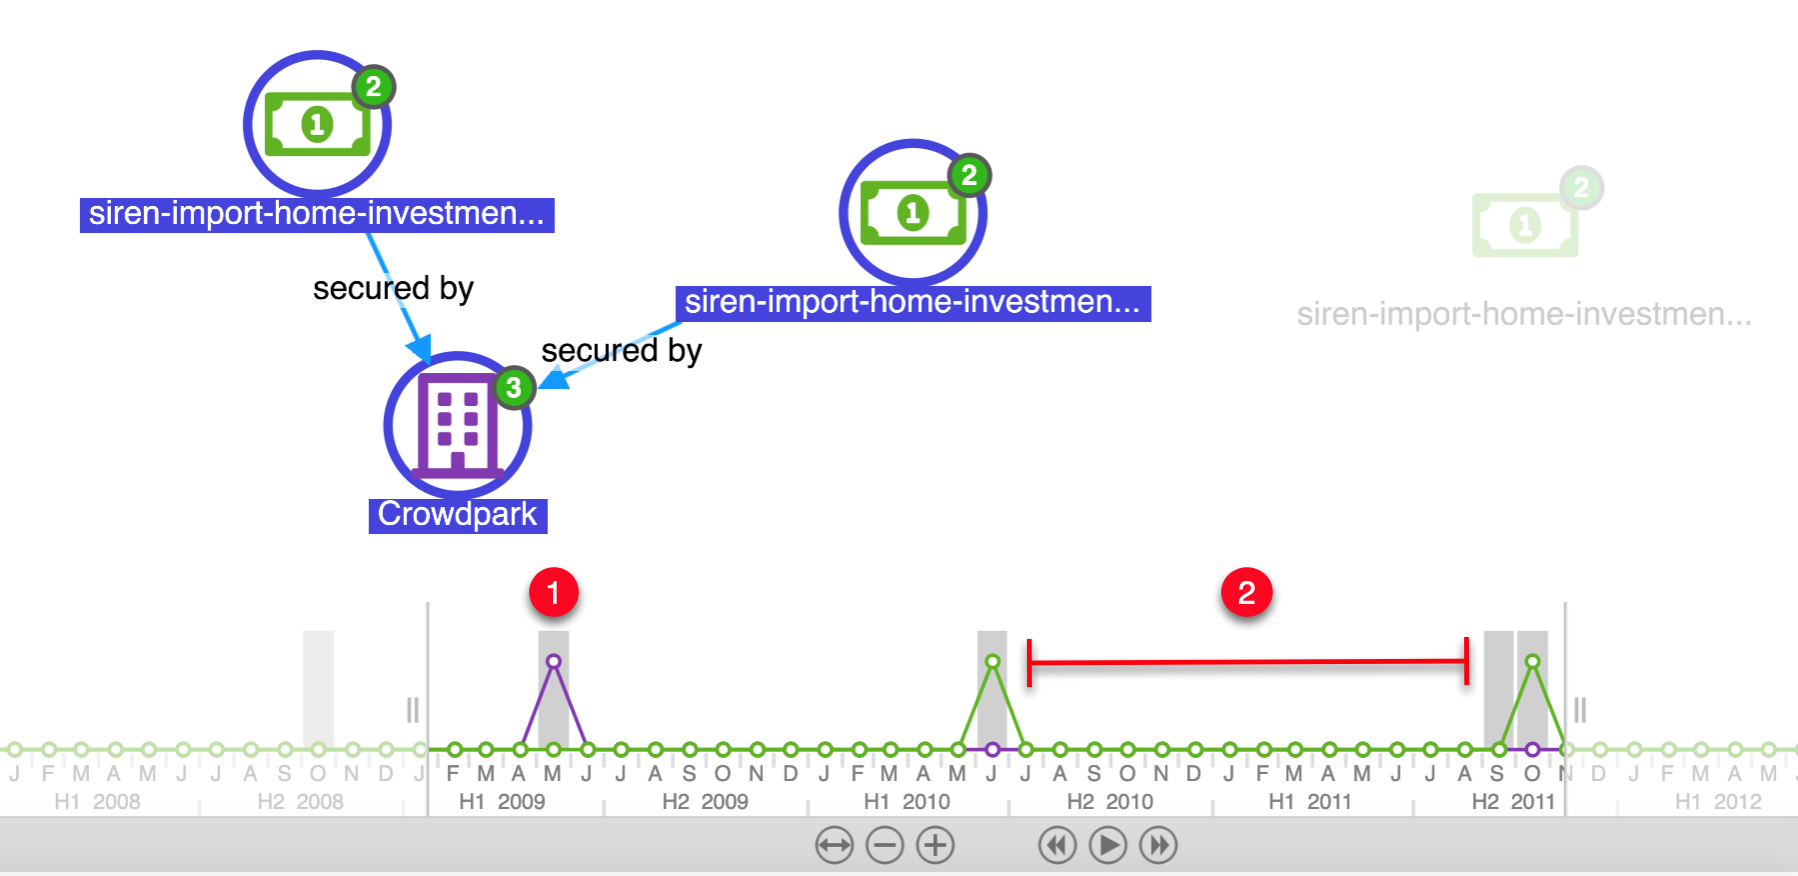
To find out, they remove all nodes by clicking Delete All in the toolbar. They open their saved graph and activate the timeline mode functionality of the graph, by clicking Time.
They select the company, CrowdPark, and the two investment nodes. The timeline view now shows the founded date of the company (1) and the length of time separating the two investments (2).

As it turns out, there’s nothing to see here.
|
This use case is extracted from the Easy Start tutorial, which provides step-by-step guidance for beginners about how to import and start analyzing data in Siren Investigate. |